


Content
+
-
- The Regulatory Environment
- The Regulatory Bodies
- The Purpose of Solvency II
- The Risk Margin
- Government Risk Margin Proposals
- Matching Adjustment and the Fundamental Spread
- Risk Margin and Matching Adjustment Reform Potentially At Cross-Purposes
- Rating Productive Assets
- Regulatory Uncertainty
- Eligibility for the Matching Adjustment
- Using the Prudent Person Principle
- The Chicken and Egg Problem
- Not Missing a March: Solvency Capital Requirements
- Regulatory Perspectives
- Ensuring A Regulatory Shift
- Competing Objectives: Experiences from Other Jurisdictions
- Separating Growth from International Competitiveness
- Powers of Review
- More Ambition Needed: Reform of the Charge Cap
-
- Introduction
- The Defined Contribution Pension Market in the UK
- The Structure of the UK Pension Market
- Australian Superannuation
- Value for Money
- Investing in Alternative Assets
- How Australia Consolidated
- Recent Changes
- Current Plans in the United Kingdom
- Master Trusts
- Where the Financial Services and Markets Bill Can Help
- Better Public Sector Pensions
- Improving the Local Government Pension Scheme
- Solvency and Performance of Canadian Schemes compared to the LGPS
- Making Structural Change
- The Dutch Approach
- Managing Civil Service Pensions and Boosting Investment
- The Opportunity
- Exploring the Case for Funded Pensions in the UK
Foreword
Tony Danker
Director General of the Confederation of British Industry
These are tough times for business leaders. The headwinds – rising inflation and energy costs, a tight labour market, the bleak economic outlook – are many. And, in these fiscally constrained times, Government’s ability to create tailwinds is limited too.
That said, there are opportunities – there are always opportunities – if you know where to find them. Unleashing Capital identifies some of the barriers to businesses and pinpoints low- or no-cost ways to sow the seeds for growth. It’s a measured, evidence-based list of practical steps that policymakers and political leaders can take to create long-term prosperity.
Many of the recommendations reflect the asks of businesses within CBI membership. They want to see greater collaboration between national and local institutions, a simplification of ways of working. They would prefer an outcome-based approach to regulation. And they’d also like to see regulatory reform where existing rules stifle innovation.
The businesses I represent are demanding stability – both political and economic stability. They’re doing so because that is the precursor to growth. Without confidence in the UK and an understanding of the UK’s plan for growth, investors will simply wait and see before investing. And right now, we don’t have that time to spare.
Unleashing Capital presents some practical and highly relevant ideas – ideas that should challenge Government and policymakers to think about growth differently. It’s this kind of radical thinking that can help shake the UK out of its low-growth state and kick-start the next wave of investment, prosperity and productivity.
Next chapterExecutive Summary
The United Kingdom is one of the world’s leading financial centres. Pension wealth in the UK is £3.4 trillion, the second largest in the world after the United States. The UK’s asset management industry is the largest in Europe. The UK’s insurance investments are the second largest in Europe.
Yet despite these inherent advantages, UK institutional investors do not invest proportionately in the kinds of assets that spur economic growth and create long-term prosperity. UK pension funds and insurers are less likely to invest in infrastructure, private equity, venture capital and private credit than their international counterparts.
This contributes in part to the UK’s weaker economic performance. UK cities are less productive. UK infrastructure is less competitive. UK venture capital is growing more slowly. UK firms find it hard to scale-up, for lack of long-term funding options.
UK pensions allocate 7% of their assets to alternatives – such as property, private equity and infrastructure. The average amongst the countries with the largest pension markets, the ‘P7’1The ‘P7’ is comprised of Australia, Canada, Japan, Netherlands, Switzerland, UK, US is 19%. If the UK increase its allocation in these alternatives to the P7 average, and just 10% of that amount was invested in the UK, this would in theory release £40.6 billion for UK investments in private equity, infrastructure and property.
In terms of the insurance investments, the UK allocates significantly less, proportionately, than Germany, France, Italy and Spain. In terms of investing in infrastructure funds, private equity funds, real estate funds, and property, UK insurers come second last out of the 10 largest European markets. If the UK invested in infrastructure at the same scale as France, there would be £10.2 billion more for infrastructure funds, £13.2 billion more investment in private equity funds and, overall, an additional £71.6 billion invested in alternatives and property. These may seem like large numbers, but the actual shifts in terms of overall investment proportions are very small. For example, to invest like France in infrastructure funds, UK insurers would have to shift their exposures less than half of a percentage point. This is not fundamentally radical, but it would have significant consequences.
To be clear, this report is not suggesting that the Government can direct institutional investors to invest in particular assets. Far from it. Pension funds and insurers have responsibilities to their policyholders and their pension scheme members, and they must generate the proper returns and protection for their clients. However, this report identifies key ways in which the regulatory and market environment hinder investment in a wider range of assets that are available to international insurers and pension funds. These regulatory burdens are complex; for instance, all EU markets are subject to Solvency II, and yet EU insurers tend to invest more in alternatives, thanks to specific ways Solvency II is applied in different jurisdictions. Reforming Solvency II in the UK is not just about developing tailor-made rules in London but ensuring that the UK regulators are doing so in a way that promotes growth and diversity.
This report aims to tackle the complexity of these issues head on, to mobilise investment across the UK. It makes recommendations in four areas:
- The Regulatory Environment
- The Structure of Pension Markets
- The Role of Local Government
- The Role National Institutions
Some of the recommendations this report makes are technical, and some are strategic; many involve an element of both perspectives. This may appear incongruous, but it is a demonstration of how difficult and complex the problem of mobilising capital in the UK is. Better national institutions could potentially create more projects of investment, but if the regulatory environment does not change, this will make little difference. Conversely, improving the regulatory space will only get you so far if national and local institutions are not able to promote and create greater investment opportunities.
To underline the point again, this report is not suggesting that these changes can happen overnight. Pension funds and insurers have vital responsibilities to ensure that they meet their liabilities, those factors must be paramount. Rather, the argument set out here suggests simply that the current regulatory environment and market structures are not optimal, and that genuine improvements can be made to how the Government regulates and how markets operate.
To balance the broad analysis with implementable policies, this report is structured around four key strategic priorities for Government, under which sit 20 recommendations. The strategic priorities are as follows:
Strategic Priority 1: Creating A Better Regulatory Environment
Government should prioritise a regulatory environment for the financial sector that encourages diversification, policy holder returns, and balances policyholder protection and financial stability with competitiveness and growth. Recommendations that will help fulfil this strategic priority include
- Ensuring that growth and competitiveness are properly balanced against other statutory objectives, by making growth a primary objective and ensuring that the regulators publish an explicit document on how the secondary international competitiveness and competition objectives are to be balanced
- Reforming Solvency II insurance regulation in a way that facilitates significant investment from the sector, by making the right reforms to the Fundamental Spread, Matching Adjustment, and Solvency Capital Requirements
- Developing the regulatory investment framework for insurers, the Prudent Person Principle, to increase transparency and be more accommodating for alternative, growth-supporting assets.
- Ensuring that a regular review cycle of rules is created to ensure that genuine reviews can occur without the spectre of Government interference
- Reforming the pension charge cap, and in particular to ensure that reform excludes the fixed element of carried interest
Strategic Priority 2: Making A Better Pension Market
Government should prioritise reforming and consolidating the pension market. The UK should look to international comparators, such as the Netherlands, Canada and Australia to find examples of strong pension markets that invest in alternative assets and contribute to economic growth. Recommendations that will help fulfil this strategic priority include:
- Launching a consultation in regard to reducing barriers to consolidation in the pension market, and proposing expanded powers and remit for the current value for money test
- Using the ‘have regard’ powers in the Financial Services and Markets Bill to ensure regulators consider the impact of regulations on the prospects for consolidation
- Consolidating the current LGPS structure to reflect international best practice, as shown in the Canadian and Dutch public sector pension models
- Issue a call for evidence on shifting to a funded model of public sector pensions
Strategic Priority 3: Empowering Stronger Local Government
Local Government in the UK is fragmented and weak compared to its international peers. Government should look to devolve powers to local communities that reduce political risk and increase the ability of local communities to fund local projects with their own resources. Recommendations that will help fulfil this strategic priority include:
- Being more ambitious in developing devolution deals, aiming to expand existing combined authorities and ensuring new combined authorities cover large, economically viable areas.
- Devolving the full suite of strategic planning powers to combined authorities, including the creation of statutory spatial frameworks and Levelling Up Innovation Zones.
- Fully devolving business rates to combined authorities, including the power to re-design valuations, change multipliers, and set reliefs according to local needs, and embracing multi-year funding settlements.
- Use the LIFTS model to develop similar investment vehicles for local infrastructure facilities. Ensure that local Mayors can encourage regulatory collaboration and convene national institutions.
Strategic Priority 4: Building More Collaborative National Institutions
National institutions in the UK can be better used to encourage productive investment from institutional investors and create a more collaborative environment. Government should work to ensure that national institutions are as effective as possible in meeting the UK’s investment goals. Recommendations that will help fulfil this strategic priority include
- Finalising plans for the UKIB and publishing its methodology for assessing additionality, so that firms have certainty.
- Developing an MoU between Homes England and the UKIB with a view to a possible merger. Homes England and the UKIB should be encouraged to develop a strong relationship, and Government should review whether these institutions should be merged.
- Using the British Business Bank to better co-ordinate the multitude of different private-sector and public-sector bodies responsible for increasing economic performance and investment in business.
- Foreseeing significant capital investment from Solvency II reform and the FSM Bill, Government should create a UK Institutional Growth Fund to spur growth and create co-investment opportunities with the private sector.
- Leveraging the British Business Bank’s role in increasing access to equity and credit for small and medium-sized firms and increase access to institutional investment. The British Business bank should work with regulators to make more businesses viable investment propositions for institutional investors, and create a bespoke fund to test new regulatory approaches
These recommendations range from big to small, from calls for evidence to technical changes. However, the range of suggestions put forward demonstrate the scale and complexity of the challenge facing the United Kingdom. This report hopes to come to grips with that challenge and spark a conversation on how the UK can seize the opportunities sitting here already. The Government rightly makes much of the need to unleash all the strengths of the UK economy. It will not be able to do this without unleashing capital.
Next chapterIntroduction
The Economic Context
The United Kingdom’s current economic woes are particularly long-term and acute. An OECD projection from late 2021, before the economic shock, predicted that the UK, to 2060, would have a slower GDP per capita growth than the Euro area and the G7. If the GDP growth of the last decade were to be replicated in this decade, the UK would become the poorest country in the Anglosphere by 2028.
Productivity has also suffered. The UK has had the second weakest productivity performance in the G7 between 2009 and 2019.2ONS, International comparisons of UK productivity (IP), final estimates: 2020. 20 January 2022. Link. If UK productivity per hour had kept pace with the previous decade, each worker would be producing £6.62 more per hour worked.3Author’s calculations
Figure 1: Actual vs Trend GDP Per Hour Worked, 2015 PPP, USD
The Importance of Levelling Up
Part of the UK’s economic problem is the unequal growth and productivity experienced by different regions of the UK.
Between 2000 and 2019, London was the only region of England which beat the English growth average. No other major economy only has one region so outperforming.
Figure 2: Regional Growth Rates compared to the England Average, 2000-2019
Furthermore, cities outside of the South East have weaker productivity than they should. The productivity gap between large cities in the UK and other major international economies is larger in the UK than it is in many other economies, like Germany, Japan and Australia.4OECD, Enhancing Productivity in UK Core Cities. 2020. Link. In February 2020, the Centre for Cities found that if the eight largest cities in the UK reached the productivity levels of the Greater South East, the UK economy would be £47.4 billion larger.5Centre for Cities, Why big cities are crucial to ‘levelling up’. February 2020. Link.
In absolute terms, recent analysis shows that the UK is the most inter-regionally unequal country in the OECD with more than 11 million people. At the TL3 level, which is an international standard for measuring smaller regions, the UK is the second most inter-regionally unequal country in the OECD.6McCann, Philip. Perceptions of Regional Inequality and the Geography of Discontent: insights from the UK. 29 November 2018. Link.
Significant investment gaps persist too. Average gross fixed capital formation (GFCF) in the UK per capita was £5,488 in 2020, yet only three regions exceeded the average – London, the South East and the East.7Author’s calculations, using ONS. Experimental regional gross fixed capital formation estimates by asset type. 10 May 2022. Link.
Figure 3: Per Capita Gross Fixed Capital Formation, 2020
ONS8Ibid.
Over the last 15 years, London and the South East have rapidly eclipsed the rest of the UK when it comes to net investment (GFCF) in absolute terms too, as shown by the figure below.
Figure 4: Gross Fixed Capital Formation by Region, Current Prices 1997-2020
ONS9Ibid.
If the three weakest regions alone – Wales, the North East, and the West Midlands – raised their net investment to the national average, this would inject more than £17 billion into the economy. If the North and the Midlands together were brought to the national average, it would increase gross fixed capital formation by £26 billion.
Generating Investment
It would be a mistake, however, to define the challenges in the UK solely as questions relating to the distribution of growth, or one confined to problems in certain regions. The UK economy is not good enough at generating private domestic investment and as such UK growth has not been strong as it could be. If UK GDP per capita growth continues on its current trend since 2008, the UK will be the poorest country in the Anglosphere by 2028.10OECD. GDP Per capita. Constant prices. In 2008, household disposable income was only $1,500 higher in Germany. German households are now more than $7,000 richer.11OECD.
Investment as a percentage of GDP in the UK has been persistently weaker than any other G7 country except Italy since 1980.
Figure 5: Investment as a Percentage of GDP
IMF
British capitalism is becoming less dynamic. The market capitalisation of the top 10 companies in the UK increased from £0.7 to £0.8 trillion between 2000 and 2021, whereas the top 10 US companies increased their capitalisation from £1.5 to £9.1 trillion. In other words, the top 10 companies increased their market capitalisation by 14% in the UK in 21 years, and 507% in the United States.12Lakestar, The UK Financing Gap. June 2022. Link. Since 2010, the London Stock exchange has lost nearly a quarter of its listings.13London Stock Exchange Group. London Stock Exchange: Issuer List Archives 2010-2021. Link. These challenges are compounded by the fact that public markets in the UK have also suffered. The FTSE 100 has underperformed both the US S&P 500 and similar indices in Germany and Japan over the last two decades.14Cheffins, Brian and Reddy, Bobby. Resuscitating the London Stock Exchange. 1 June 2022. University of Oxford, Faculty of Law. Link. Listings on the London Stock Exchange have fallen by nearly a quarter since 2010.
Figure 6: Issuers Listed on the LSE, December
London Stock Exchange Group
Outside of public markets, the UK is also at risk of losing ground in the growth economy. According to OECD data, the UK has experienced only middling growth in venture capital compared to our peers over the last decade. While the UK has started in a strong position, there are competitors coming online.
Figure 7: Venture Capital Total Growth 2010-2021
OECD, Author’s calculations
In European markets, the lack of institutional investment from the UK is palpable. In the latest State of European Tech report, in every year since 2016 except 2019, the UK and Ireland have had less investment dry powder for VC than France and the Benelux countries, and UK pensions provide only 6% of all pension investment into European venture capital.15Atomico, State of European Tech 2021. Link. This at a time when Lakestar, a leading investment fund, has suggested that there is currently a gap of £1.5 trillion in growth financing needed to make UK markets more dynamic and put the UK on a higher growth trajectory.16Lakestart
| Different Kinds of Capital | ||
| Private Equity
Private equity, or unlisted equity, is investment of equity into private companies. Unlike venture capital, these typically are in mature companies, and may involve investing in a firm to execute a restructuring or a different management strategy. Private equity investments are not listed on stock markets, and typically have relatively illiquid structures and longer- term time horizons – such as 10 years. |
Venture Capital
Venture capital is another form of private market funding. Unlike the broader category of private equity the firms in question are new, ‘start-ups’ or relatively small or medium-sized businesses with a relatively high chance of failure, but conversely with strong growth potential. The potential investments are almost never listed. |
Growth Funding (or ‘patient capital’)
Growth capital operates in the intermediate space between venture capital and mature private equity. In the UK, growth capital entities like the Business Growth Fund (BGF) aim to invest in companies that are ready to scale up, but have either not entered public markets, or need long-term capital for growth. Unlike private equity and venture capital where there is, even on a longer time horizon, an immediate look for an exit, growth capital seeks to stay with a company without a definite exit point. |
Growing companies and scaleups are a vital part of the economy. Companies that are scaling up and growing are more profitable, deliver higher wages and are a vital part in closing the gap in economic disparities.17Oxford Economics, The Contribution to the UK Economy of Firms Using Venture Capital and Business Angel Finance, Prepared for the BVCA. April 2017. Link. Yet there are significant funding gaps for these kinds of companies in the UK economy. The Scaleup Institute estimates that, in the aftermath of the COVID-19 pandemic, there is a structural gap of £5-£10 billion per annum, and a cyclical gap of £7.5 billion per annum.18Scaleup Institute, The Future of Growth Capital. August 2020. Link.
This funding gap also does little for regional policy and growth. Contrary to what may be popular belief, only 33% of growth companies are located in London. 32% are located in the Midlands and North.19Seldon, Sir Anthony and Welton, Stephen. From Survive to Thrive. University of Buckingham and the Business Growth Fund. 2020. Link. A focus on growth capital will help every part of the country.
Tomorrow’s Infrastructure
These funding gaps do not just present in private equity and venture capital either. There remains significant net zero and infrastructure gaps too. The UK Government expects that to 2030, the infrastructure20It is important to highlight too the difference between operating and building infrastructure. Some institutional investors may choose to invest in utilities and other facilities that are already built, others in infrastructure bonds and equity that contribute to the building of infrastructure itself. In both cases, capital helps improve stock and contributes to growth. pipeline will amount to £650 billion. Some estimates put the Net Zero infrastructure needs at £400 billion alone to 2050.21PWC, Unlocking Capital for Net Zero Infrastructure. November 2020. Link. Yet, despite this, the entire UK Investment industry invests only 2.4% of its UK assets in infrastructure22The Investment Association, Investment Management in the UK 2020-2021. September 2021. Link. , a figure unchanged since 2019. Of its total assets under management, the UK invests 0.4% in UK infrastructure.
Here too, the UK needs to catch up to its peers. A 2015 OECD paper noted that the UK’s quality of infrastructure ranked 27th, in the middle of international rankings. The UK invested less than Canada, France and Switzerland and higher than the United States.23Pisu et al, Improving Infrastructure in the United Kingdom. OECD. 6 July 2015. Link. More recently, the Government has identified the need for £650 billion of public and private investment to 2030/31.24Infrastructure and Projects Authority. Analysis of the National Infrastructure and Construction Pipeline 2021. Link. The investment gap on Net Zero assets to 2050 remains. A report by PWC found that the UK had a £400 billion infrastructure gap to 2050. To put that in perspective, in 2019 only £20 billion was invested in all infrastructure by private entities.25PWC, Unlocking Capital for Net Zero Infrastructure. November 2020. Link.
Unlocking Capital
All these economic problems occur despite the fact that the UK has some of the most successful financial markets and largest pools of capital in the world. The UK is one of the world’s largest and most successful financial centres. The international bond markets in the UK are the largest in the world, and assets under management in the UK are the largest in Europe, and the second largest in the world after the United States.26The City of London. The Global City. 2022. Link.
Despite having £3.4 trillion in pension assets, the second largest in the world, UK pensions underinvest in the productive finance that would fund increased infrastructure and provide the long-term capital needed for scale-up businesses. This is not a new problem. As the 1931 Committee on Finance and Industry (colloquially known as the Macmillan Committee) makes clear, underinvestment has been a persistent fact about the UK economy. As the Committee says:
“…speaking generally, the exceptional merits of the City of London lie in the facilities given by the short-term money market for the employment of home and foreign funds; in the financing of trade and commerce, also both home and foreign; and in the issue of foreign bonds, as distinguished from the financing of British industry….the relations between the British financial world and British industry, as distinct from British commerce, have never been so close as between German finance and German industry or between American finance and American industry.”27Committee on Finance and Industry, Report of the Macmillan Committee. C.P. 160 (31). Copy from the National Archives, digitised. 1931. Link.
Fixing the underinvestment problem will also not solve every ill. Global macroeconomic forces are strong, and there are many challenges external to the UK economy that trouble it.
But that does not mean that institutional underinvestment is not important. Across insurance and pensions, more capital could be mobilised, and greater investment could be accessed.
Underinvestment: Pensions
UK pensions notably underinvest in productive assets relative to their international peers, despite the fact that the UK has the second largest pool of pension assets in the world.
Figure 8: Total Assets (USD Billion)
According to the latest asset survey of pensions in the largest pension markets, only 7% of UK pension assets are diverted to other assets, like infrastructure, venture capital and real estate. The average amongst countries with large pension assets is 19%. If the UK could attain that level, with assets worth £3.4 trillion, it would unlock £406 billion for other assets.
Figure 9: Asset Allocation, Pension Funds
An investment injection on this scale likely won’t happen, not least because the share of the UK pension portfolio invested in other assets has actually decreased over the last five years. This is in large part driven by the closure to new applicants for many DB schemes, and and the fact that DB schemes have turned cash-flow negative, meaning they are paying out more than they are taking in in contributions.28Baker, Mark and Adams, John. Approaching the endgame: the future of Defined Benefit pensions in the UK. October 2019. Link.
| Defining ‘Alternative’ |
| ‘Alternative assets’ can mean different things – different estimates can give different results. In the case of this report, some estimates suggest investment in alternatives higher than those suggested by the Global Pensions Asset Study. The latest Mercer asset study suggests that DB schemes invest more in alternatives than the European average (23% vs 20%).29Mercer. Investing in the Future. European Asset Allocation Insights 2021. 2021. Link. However, when these statistics are disaggregated, what counts as an ‘alternative’ is wider than what is indicated by the ‘other’ category in relation to the GPAS. Tor example 37% of UK’s DB ‘other’ asset allocation according to Mercer is invested in growth fixed income, and 25% of the ‘other’ asset allocation is made out of bulk annuities and the LDI strategy. Only 8% of the UK’s alternative asset allocation total portfolio for DB would obviously meet the alternative asset qualification for the Global Pension Asset Survey, and another 30% of the ‘other’ portfolio is made up of hedge funds and diversified growth funds.30Ibid. By contrast, alternatives in the Global Pension Asset Study are clearly meant to mean private assets, namely “real estate, private equity and infrastructure” and these are the dominant element in the Global Pension Asset Study’s definition of ‘other assets’.31Thinking Ahead Institute. Global Pension Asset Study 2022. Link. For its part, the Pension Protection Fund Purple Book, the gold standard when it comes to DB reporting, finds that only 9.1% of DB pension funds in the UK were invested in “other assets”.32Pension Protection Fund. Purple Book 2021. 2021. Link. While it includes private/unquoted equity within equities, counting this in the ‘other’ category would still indicate a 12.9% allocation to alternatives in 2021.33Ibid. See Figure 7.5.
The same dynamic is seen in the UK DC market. Mercer’s study of the DC pension landscape finds that, despite listing the UK’s overall asset allocation at 33%, this allocation is nearly three quarters hedge fund, only 9% real assets and 0% private equity.34Mercer. Investing in the Future. DC Asset Allocation Trends across the UK and Europe. 2021. Link. In short, by the alternative definition this paper seeks to use, which is drawn more closely around productive – and mostly illiquid – assets, Mercer finds that UK DC schemes likely allocate something like 3% to these assets.35Ibid. See Figure 16. In short, and noting the difficulties in getting a true picture of asset allocation, the Global Pension Asset Study survey estimates are reflective of the distribution of the kinds of alternative assets in which this paper focuses, and therefore is a worthy comparative tool across various pension markets. |
Figure 10: Allocation to Other Assets
Global Pension Asset Study – Years 2018-2022
This is not a new problem, and in fact it will likely get worse in the short term, as defined benefit pensions de-risk, for perfectly valid reasons related to their sustainability and the maturing age of many scheme members. As DB schemes close, they will look to invest in less risky assets, in particular bonds or look to pension buy-outs into annuities. As such, in the short term the relative underinvestment problem may According to the Pension Protection Fund, the share of equities as a proportion of UK defined benefit pension schemes has fallen from 61.1% to 19.0% in 2021.36 Pension Protection Fund. The Purple Book 2021: DB pensions universe risk profile. 2022. Link. Alternative asset investment has stayed constant over the last 15 years while the share of investment taken up by bonds has increased significantly. Property investments as a proportion of asset allocation has risen only slightly, from 4.3% in 2006 to 4.7% in 2021.37 ibid
This trajectory has made it even more important then to ensure the defined contribution pension market is able to invest in illiquid assets; DC schemes are projected to be valued at £1 trillion by 2030. If the UK allocated assets like Australian funds could result in £80 billion for infrastructure, £80 billion for other property, £50 billion for unlisted equity, and £10 billion for hedge funds.38 Author’s calculations based on distributions found in ASFA. Superannuation statistics. August 2022. Link.
Currently the scale of this underinvestment has significant implications. For example, despite having the second largest pool of pension assets in the world, only 6% of European VC is raised by UK pension funds – the lowest in Europe. Despite the fact that the UK has a leading financial sector, institutional investors find themselves ‘outcompeted’ for infrastructure assets from other jurisdictions.39 Cipriani, Val. Pension funds ‘outcompeted’ on UK green infrastructure investments. November 29 2021. Link.
Figure 11: Weighted Average Asset Allocation, UK Defined Benefit Schemes
Pension Protection Fund, Purple Book 2021 Figure 7.2
Underinvestment: Insurance
Insurance offers a similar tale of relative underinvestment. Insurance firms in the UK invest significantly less in illiquid assets than similar economies, even though the UK has some of the largest pools of insurance assets in the world.
Figure 12: Solvency II Asset Exposures, Euro Millions
EIOPA
When it comes to private equity, insurance companies the UK is near the bottom as a proportion of investments. While the OECD dataset is incomplete, the data that does exist shows significant differences between jurisdictions, and the relative lack of investment by UK insurers in unlisted equity and land and buildings.
Figure 13: Proportion of Investments in Unlisted Equities, Domestic Undertakings
OECD
Figure 14: Proportion of Investments in Land and Buildings, Domestic Undertakings
OECD
The number are even more remarkable when looking at total balance sheets between Solvency II jurisdictions. Until the end of 2020, EIOPA, the European financial regulator, maintained detailed national balance sheets of every European economy subject to Solvency II. The scale of UK underinvestment is stark. The UK’s total assets at the end of 2020 was the second largest in Europe, aside from France.40EIOPA. Insurance Statistics: Balance Sheet by Item Yet, investments in general made up only 35% of total assets in the UK, compared to 83% in Germany and 76% in France. Moreover, as a proportion of total assets, France invested 28 times more in unlisted equity than the UK, Germany invested 10 times more, and in terms of property41Property for Own Use, Germany and France invested twice as much.
Figure 15: Unlisted Equities, Percentage of Total Assets
EIOPA
Figure 16: Property Not for Own Use, Percentage of Total Assets
EIOPA
In terms of total exposure to various collective investment funds, here too the UK is a relative outlier. Infrastructure funds make up just 12% of the UK’s Solvency II exposure, compared to .34% in Germany and .6% in France. Similarly, UK Solvency II exposure to private equity funds is only 0.19%, compared to .36% in Germany and 0.81% in France.42A full breakdown is available in Appendix 2. Even considering alternative funds, where the UK invests relatively more, the total exposure to infrastructure, private equity and alternative funds is .79% in the UK, compared to 1.0% in Germany and 1.84% in France. Even assuming the UK shifted its allocations in funds to the German level – so 1% of exposures, this would still unlock £4.42 billion. If the UK shifted to the French proportion of investment, it would shift £22 billion into these funds.43EIOPA Insurance Statistics – Exposure Data. Q4 2020.
Overall, it is clear that the UK relatively underinvests in productive assets compared to international and European peers. But, it should also be made clear that this report is not advocating a free for all. While France invests significantly more in unlisted equities, unlisted equities still make up less than 1% of the balance sheet. In terms of property, this still makes up less than 2% of assets in both Germany and France. What this report is advocating is a shift, but a shift of a percentage point at most.
Figure 17: UK Life Sector - Pension Buy-Ins/Buy-Outs
Fitch Ratings44FitchRatings. Pension Risk Transfer Growth Sets UK Life Sector Apart. 9 February 2022. Link.
This is the paradox that sits at the heart of the debate around regional inequality and growth in the United Kingdom: it is the very resources located in London’s international financial markets that can make the most impact. It is often assumed that when speaking about Levelling Up, it is inherently about bending market outcomes, and spending substantial sums of public money on local projects. Conversely, to speak about growth and the venture capital economy is to invite assumptions that one is really concerned with the traditional, financialised, model of UK macroeconomic growth – one centred on London and the South East.
In fact, neither of these narratives does any justice to the current needs of the UK economy. Levelling Up is led by substantial private investment, and that private investment can be catalysed at scale by public investment. The pools of capital, in abundance in London like no other major city save New York, will be a crucial part of ensuring that every part of the United Kingdom is successful. That does not mean that all capital needs to be placed in the UK – indeed a vital part of de-risking a portfolio is ensuring international breadth, but it is certain that pension funds and insurers could invest more in productive assets in the UK. The fact is that these pools of capital have not been put to as good of a use as they should be. This paper looks at insurance and pensions as tools to inject billions into the UK economy, and to power growth in every region of the country.
The Economic Impact of Productive Investment
The economic impact on unlocking capital for productive investment is also clear. The multiplier effect of investing in infrastructure is large, markedly larger than general investment.45Global Infrastructure Hub. Fiscal multiplier effect of infrastructure investment. 14 December 2022. Link. Private investment can have an even greater impact on economic growth.46Unnikrishnan, Nishija and Kattookaran, Thomas P. Impact of Public and Private Infrastructure Investment on Economic Growth: Evidence from India. 9 December 2020. Link. The positive impact of infrastructure growth is now well established in the literature.47Whittle, James. A Short Synthesis of the Link between Infrastructure Provision/Adequacy and Economic Growth. August 2009. Link.
The same is true of private markets and venture capital. The social return of venture capital is significantly higher than business or public research and development.48Romain, Astrid and Pottelsberghe, Bruno van. The Economic Impact of Venture Capital. 2004. Link. A more recent study found that a lack of venture capital funding would lower growth by over a quarter.49Akcigit et al. Synergising ventures: the impcct of venture capital-backed firms on the aggregate economy. 24 September 2019. Link. The same study showed that venture capital backed firms see employment increase by 475%, compared to 230% for other companies.50Ibid.
More broadly, long-term growth capital has a positive impact on the economy. One study looked at over 17,000 firms, and showed that firms with long-term finance were more likely to invest in innovations and have a greater share of permanent employees.51Sommer, Christoph. The Impact of Patient Capital on Job Quality, Investments and Firm Performance. December 2020. Link. Scale-up firms, who are most likely to need growth or patient capital, are net job creators and firms younger than five looking to expand created 2.6 times their share of total employment.52Coutu, Sherry. The Scale-Up Report on UK Economic Growth. November 2014.
Productive investment has significant positive impacts on the economy, but capital is needed. That is where this report seeks to make its impact.
Addressing the Barriers to Success
In order to unleash the promised capital, Government should identify the following four strategic priorities:
1. Creating A Better Regulatory Environment
Government should prioritise a regulatory environment for the financial sector that encourages diversification, policy holder returns, and balances policyholder protection and financial stability with competitiveness and growth.
2. Making A Better Pension Market
Government should prioritise reforming and consolidating the pension market. The UK should look to international comparators, such as the Netherlands, Canada and Australia to find examples of strong pension markets that invest in alternative assets and contribute to economic growth.
3. Empowering Stronger Local Government
Local Government in the UK is fragmented and weak compared to its international peers. Government should look to devolve powers to local communities that reduce political risk increase the ability of local communities to fund local projects with their own resources.
4. Building More Collaborative National Institutions
National institutions in the UK can be better used to encourage productive investment from institutional investors and to create a more collaborative environment. Government should work to ensure that national institutions are as effective as possible in meeting the UK’s investment goals.
To explore how these four strategic priorities can be met, this report proceeds in five chapters.
1. The Investment Case for Illiquid and Alternative Assets
This chapter outlines how and why alternative assets are an important investment option and looks at models where alternative assets have led to high growth. This chapter looks at, , why there is particularly a strong investment case for investment even if UK institutional investors tend to avoid them, relative to international peers.
2. The Regulatory Challenge
Chapter 3 sets out the basic features of institutional investment in the UK, and why institutional investment capital has not been invested in infrastructure, private equity, venture capital and other alternative assets. This chapter examines how Solvency II can be improved, what further changes might be made to the Solvency II regulations, and how regulators can work more closely with firms.
3. Better Pension Markets
Regulatory change is an important aspect of creating better markets. However, it is not enough, on its own, to create the long-term, durable change necessary to unlock capital. This chapter focuses on how the pensions market should consolidate further, so that pensioners and their portfolios can benefit from scale. Chapter 4 also considers arguments around the charge cap, and why it should be deregulated, but only in the context of a consolidating market that returns value for investors.
4. Stronger Local Institutions
Along with fostering better markets through better regulation and better structure, the UK also needs the local and national institutions to create pipelines for projects and the viable investment proposals that can attract institutional investment. Chapter 5 looks specifically at how the current local government landscape is too complicated, is fraught with political risk and lacks some of the key fiscal powers that could be used to de-risk investment and encourage institutional partnership.
5. Better National Collaboration
Local institutions also need to be complemented by national organisations which can fulfil their mandate and deliver investment for local communities. Chapter 6 sets out ways that that they can be improved, by in particular looking at the UK Infrastructure Bank, the British Business Bank, and the Business Growth Fund.
Together, these measures will address the long-term investment challenges the UK faces. As this report demonstrates, the United Kingdom has the resources to face these challenges. It is now time to unleash them.
Next chapterChapter 2: The Investment Case for Illiquid and Alternative Assets
It is sometimes argued that illiquid assets are fundamentally unattractive in the UK context. The argument is that infrastructure, private equity and other alternatives are simply too risky and so should not play a large part in an investment portfolio. This is misguided. The evidence suggests that illiquid assets
- Generate better returns
- Can help hedge against risk by diversifying portfolios
- Can be part of a sound investment strategy
This chapter aims to show why alternative assets are vital to strong investment portfolios.
Illiquidity Risk
It is true that illiquid assets carry risk. Unlike many forms of listed assets, like listed equity, it is harder to price and to hold illiquid assets. Take for example the difference between a stock (listed equity – liquid) and an airport (infrastructure – illiquid).
- Since the stock market has a high number of buyers and sellers, it would be easy to find someone to purchase a stock, and it would be easy to price the asset in question. If you wanted to sell a stock it would be easy to do so without a discount.
- The airport, on the other hand, cannot be bought or sold easily. The market for buyers and sellers is smaller and it is harder to sell on a quick timeline. Moreover, thanks to how illiquid the market is, it is more difficult to price the asset, and so holding this asset lends itself to risk.
Bid-Ask Spread
One of the key differences between liquid and illiquid assets is the size of the bid-ask spread. The bid-ask spread is the difference between the highest bidding price for an asset, and the lowest asking price. Illiquid assets are also subject to a wider ‘bid-ask spread’ than more liquid assets. To be clear, every asset has some sort of spread, but in some cases these can be very small indeed. In currency trading, one of the most liquid forms of trading, the spread is fractions of pennies. In more illiquid transactions, the spreads can amount to a few hundred basis points.
Transaction Costs
The other mark against illiquid assets are transaction costs. Illiquid asset classes can be harder to manage and impose higher transaction costs. Many illiquid assets are complex, have higher management and legal costs, and invariably make the purchase of the asset more expensive. This is why institutional investors that have a strong record in investing in illiquid assets (such as Canadian pension funds), have developed in-house teams to manage assets, to create internal economies of scale. This is discussed further in chapter 4.
Illiquidity thus has some real risks and costs. A famous example of when illiquid assets proved unhelpful is none other than one of the most famous and prestigious institutional investors in the world: the Harvard Endowment. In the lead up to 2009, Forbes described it like this:
For a long while Harvard’s daring investment style was the envy of the endowment world. It made light bets in plain old stocks and bonds and went hell-for-leather into exotic and illiquid holdings: commodities, timberland, hedge funds, emerging market equities and private equity partnerships.53Forbes Magazine, Harvard: the Inside Story of It’s Finance Meltdown. 26 February 2009. Link.
Harvard tried to liquidate its illiquid holdings, particularly private equity, which resulted in significant losses as bidders were demanding significant discounts. This remains one of the most significant examples of where overinvestment in illiquid assets can have a serious, detrimental effect on the underlying strength of a fund.
Liquidity Premium
Because of the risks inherent in illiquid investing, illiquid assets also invite a long-term value premium, otherwise known as the ‘liquidity premium’. This premium is a result of the fact that illiquid assets do have more risk and are harder to convert into cash. This means that over time, illiquid assets should produce higher returns.
While this relationship is complicated, it does appear that many illiquid asset classes do yield higher returns as a result of liquidity constraints. This depends partly on the asset class itself – some research indicates that real estate attracts a higher illiquidity premium than, for example, private equity.54Green, Katie. The illiquidity conundrum: does the illiquidity premium really exist. Schroders. August 2015. Link.
The important role of illiquid assets is borne out when looking at the future – the return picture of illiquid assets is strong.
Return on Investment for Illiquid Assets
Indeed, despite the pitfalls of illiquid assets, they can deliver strong returns for investors. Over the last 10 years, private equity and venture capital has consistently beaten the FTSE 130, 250 and 350, as well as the all-share index.55BVCA & PWC. Performance Measurement Survey 2020. September 2021. Link.
Figure 18: Return Performance
BVCA
Data from Bloomberg also shows strong performance from infrastructure. Between 2004 and 2020, the cumulative return for the EDHEC Infra300 for every USD$100 invested is over $600, compared to just under $400 for the S&P 500 and just over $300 for the MSCI world.56Bloomberg quoted in Mercer, Infrastructure investing – A primer. 2021. Link.
Infrastructure can also be less risky over the long-term. A study by Moody’s found that infrastructure debt was at significantly less risk of default than non-financial corporate bonds over a 10-year span.
Figure 19: Infrastructure vs Non-Financial Corporate Debt Loss Rates, BBB-Rated Debt
Blackrock and Moody’s Investor Services, in Cambridge Associates
Figure 20: Infrastructure vs Non-Financial Corporate Debt Loss Rates, BB-Rated Debt
Infrastructure debt is also long-term, which helps hedge against liability. Infrastructure assets are often regulated, and investors “have a high degree of visibility into long-term cash flows”.57Cambridge Associates, Infrastructure Debt: Understanding the Opportunity. September 2018. Link.
Infrastructure returns are also strong. Compared to global equities, unlisted infrastructure generates higher risk adjusted returns and performs significantly better than global equities over a longer time horizon. Moreover, infrastructure tends to protect against inflation. According to one estimate, listed infrastructure in the United States delivered returns of CPI + 10.1% for the 15 years to 2017.58Colonial First State. Infrastructure as a Hedge to Inflation. June 2018. Link. This is partly because infrastructure assets often have revenue streams indexed to inflation or, in the case of utilities, where regulators typically grant inflation pass-through.59EDHECInfra. Inflation Risk: How Exposed are Investors in Infrastructure?. 2022. Link.
Figure 21: Risk-adjusted returns (Sharpe Ratio)
Global Infrastructure Hub60Global Infrastructure Hub. Infrastructure Equity Performance Shows Attractive and Resilience Returns for Investors. 31 March 2022. Link.
Considering Traditional Investment Strategies
Illiquid assets also play a negligible role in one of the most popular investment strategies, the ‘60/40 strategy, which is often cited as the traditional investment approach. In this strategy, 60% of the portfolio is invested in equities and 40% in bonds. It is a classic strategy because equities can generally secure higher returns and bonds provide a lower risk, so the portfolio is well balanced.
Over the last 10 years, this strategy would have worked quite well. In the United States, a 60/40 split would have outperformed cash by 10.5% over the decade up to September 30 2021.61Mercer, Top considerations for private markets in 2022. 2022. Link.
A 60/40 strategy has also worked in the context of falling interest rates over the last 50 years. Since the 1970s, bond yields have fallen and equities have risen, meaning that a conservative strategy could generate strong returns. In fact, compared to an all-stock strategy, the difference in annualised return is only 0.8%.62Donati, Edward and Johal, Ajay. The 60/40 Portfolio: Losing its balance. Ruffer Investment Management. 2020. Link.
However, the economy has entered an extremely difficult period, and the economic certainties of the past cannot be taken for granted. In the first half of 2022, the S&P 500 fell by 13.34%63Silverblatt, Howard. US Equities Market Attributes July 2022. S&P Dow Jones Indices. 2 August 2022. Link. and the FTSE is down 3% as of June 30.64Guardian Business, Global markets post worst first-half performance in decades. 30 June 2022. Link.
Moreover, these difficulties, while exacerbated by the war in Ukraine and the concomitant energy crisis, are also the result in long-term trends in the economy, such an aging population, declining workforces and continued poor productivity growth.65Schroders, Inescapable investment “truths” for the decade ahead. March 2019. Link. In fact, Schroders put forward a projection of stocks and bonds to 2027,66Prideaux, Charles and Wade, Keith. Inescapable investment “truths” for the decade ahead. Schroders. March 2019. Link. based on these and a variety of other trends, including infrastructure needs and an aging population. This data showed that equity and bond returns over the next decade are expected to drop significantly.
This state of affairs has only been exacerbated by the recent inflation caused by global factors. The high levels of inflation, energy crisis and supply-chain shocks have created a difficult international macroeconomic environment. In Schroders’ latest (2022) 10-year projection, UK and Japanese equity return forecasts improve,67Schroders. 10-year return forecasts (2022-2031). December 2021. Link. while every other forecast is downgraded. Indeed, the prospect for UK bond returns fell by another quarter, and this is before factoring in the war in Ukraine.
Figure 22: Forecasts for Equities Returns (2018-2027)
Figure 23: Forecasts for Government Bond Returns, 2018-2031
Schroders
Current inflation and rises in interest rates have forced stocks down while yields on bonds have also gone up. The S&P 500 fell by more than 20% while yields for 10 year US treasuries went up to 2.5%.68Dohle, Mona. How inflation disrupts the bond-equity correlation. 4 August 2022. Link. In the UK, the FTSE100 has dropped by 4.5% while the yield for 10-year HM Treasury bonds is nearly 2.4%.69Ibid. This makes it harder to generate the proper returns.
Bonds in particular are vulnerable to inflation. While equities can grow as prices rise, bonds see their real value fall thanks to inflationary pressure.70Donati and Johal, 2020.
More broadly than this, countries that have invested in alternative assets have also not seen comparatively weaker performance in their pension funds. Over the last 20 years, the growth rate of the P7 has been strong across the board, except in Japan. Over the last decade, the compound annual growth rate of UK pensions is behind every country (in own currency terms) except Japan.71Thinking Ahead Institute. Global Pension Asset Study. 2022. This is mitigated somewhat by the fact that the UK has comparatively lower pension contributions has a percentage of GDP (except for Canada and Japan)72OECD. Funded Pension Indicators: Contributions as a % of GDP. 2020. Link., but it does indicate that alternatives can play a prominent role in pensions’ investment strategies without sacrificing returns.
Figure 24: Pension Asset Growth, 2001-2021
Global Pension Asset Study, 2022
Assessing the Risks of Liability-Driven Investment
Moreover, ‘traditional’ investment strategies can also be fraught with unintended risk. Investing in alternative assets is not alone in being potentially risky. The UK financial markets have seen over the last number of weeks how Liability Driven Investing (LDI) has led some pension funds to the brink of insolvency.
LDI is based on a few simple rules. It divides an investment strategy into a liability risk portion and a second that aims to seek to higher returns. The liability risk portion of the portfolio is typically invested in bonds, and supplemented with swaps, derivatives and pooled funds.73Insight Investment. An Introduction to Liability Driven Investment. November 2021. Link. These assets are used to ‘hedge’ against liability. However, this hedging, when there are swift changes in the market, require the pension to post collateral if the value of the underlying assets change. This collateral usually has to be posted in the form of cash.74Jones, Huw. Explainer: What is an LDI? Liability-Driven Investment strategy explained. 4 October 2022. Link. In the UK, the risk of potential insolvency was heightened when the markets reacted negatively to the Government’s Growth Plan. As a result of this market reaction, the value of bonds went down and yields went up. Since LDI hedges were predicated on a certain value of bonds, pension funds had to put up cash to maintain the hedge. Pension funds sold bonds to acquire cash, and thus, to maintain their hedges, provoked a spiral of buyoffs. The Bank of England had to intervene with a promise to buy up to £65 billion in bonds to shore up the market.75Bank of England. Gilt Market Operations – Market Notice 28 September 2022. 28 September 2022. Link.
LDI is a strategy based in part on hedging against bond risk, but which required posting collateral (paid for by selling bonds) to maintain these hedges.. Moreover, because of the role actuarial consultants play in many pensions, UK pension plans currently have very similar risk profiles.76Zijdenos, Eric. LDI: The UK Pension Problem and the Risks in Europe. 29 September 2022. Link. Alternative assets allow a degree of risk diversity that would, at least, help prevent the kind of systemic solvency risk that has come to underly the UK’s LDI strategy, while also investing in higher-return, more productive assets than gilts and fixed income.
Next chapterChapter 3: Reducing Regulatory Barriers
The last Chapter dealt with why alternative assets can be a return-generating part of an investment portfolio. However, as shown in Chapter 2, the UK relatively underinvests in many of these asset classes. This is in part due to the regulatory regime currently in place, which poses obstacles to investing in alternative assets.
This Chapter looks at Solvency II and the pension charge cap as particular blockages, but also argues that the broader regulatory attitude should be changed to better encourage competition and growth.
The Regulatory Environment
The UK’s regulatory environment for institutional investment is disparate and spread across multiple institutions. As a result, there has been several different attempts to spur on investment in alternative assets, otherwise known as ‘productive finance’. Some key initiatives have included
- Hill Review (Listings Review)
- The Working Group on Productive Finance
- Creation of the Long-Term Asset Fund Vehicle
- Consultation on Enabling Investment in Productive Finance
- Consultation on the Future Regulatory Framework, culminating in the Financial Services and Markets Bill
- The PRA’s Discussion Paper on Solvency II
In each one of these undertakings there is an awareness that the current regulatory environment leaves much to be desired. It is to be commended that the Government has moved to rectify this situation, and that they have been joined in this by the Labour party.77Conchie, Charlie and Boscia, Stefan, Labour eyes up reform to ’prescriptive’ EU finance rules. 13 July 2022. Link.
Because of how important this issue is, and the billions of pounds of capital at stake, it is important that the Government get the reforms right. This chapter looks at exactly how that might be done, and in particular ways that the Financial Services and Markets Bill, Solvency II Reform and changes to the charge cap can encourage investment.
The Regulatory Bodies
Institutional investors in the UK are regulated through a variety of different organisations, some independent of the Government, others being Government Departments. The below figure spells out in detail the current constellation. The UK is a world leader in regulation, and its regulatory authorities are regularly consulted by others given their justifiably strong reputation. However, that does not mean that there are specific ways to improve the regulatory regime to pursue specific policy goals, in this case greater economic growth and better returns.
| UK Regulatory Organisations – Finance | |
| Prudential Regulation Authority (PRA)
The PRA was created in the aftermath of the financial crisis as one of the successors to the Financial Services Authority. The PRA is housed within the Bank of England, and is administered by the Prudential Regulation Committee – one of the two committees at the pinnacle of the Bank of England’s policy-making structure.78The other being the Monetary Policy Committee The PRA has three objectives:
The PRA regulates around 1,500 institutions, including banks, credit unions, major insurers and investment organisations.80PRA, Which firms does the PRA regulate?. Link. |
Financial Conduct Authority (FCA)
The FCA is, along with the PRA, a successor institution to the Financial Services Authority. The FCA covers around 50,000 different firms and, like the PRA, has three operational objectives:
The FCA has a role in regulating and overseeing pension providers, insurers and other institutional investors. The FCA tends to focus on the consumer aspects of these industries. For example, one of its recent regulatory initiatives was to drive the creation of the ‘pension dashboard’, which “aims to empower savers to engage with their pensions.”81FCA, FCA proposes rules for pension providers to help deliver Pensions Dashboards. 11 February 2022. Link. The FCA has a role in preventing fraud and ensuring consumers use their pensions wisely – hence the ‘safeguarded benefits’ valued at £30,000 or over.82FCA, Pensions and retirement income. 18 April 2022. Link. The FCA also authorises Long-Term Asset Funds, new vehicles to encourage alternative investment. |
| The Pensions Regulator (TPR) The TPR regulates workplace pension schemes, ensuring they are well capitalised and that pension funds have the necessary level of liquidity. TPR has a longer list of statutory objectives:
The TPR and the FCA can operate in conjunction. For example, the FCA and TPR published a joint discussion paper on Value for Money (VfM) in the defined contribution pension market. |
Department for Work and Pensions (DWP)
DWP plays a leading role in regulating and managing pension provision in the UK. While it has a primary role in distributing and setting policy for the state pension, the Department is also the sponsor for TPR. DWP publishes statistics on pensions and is also responsible for managing consultations around the pension charge cap. His Majesty’s Treasury (HMT or The Treasury) HMT plays a central role more broadly in setting all aspects of economic policy, but it is also a driver for a number of initiatives to reform financial markets. The Treasury manages the public service pension schemes, and is responsible to changes in these policies. |
In looking at the various regulatory frameworks, this report will focus in particular on the PRA, as it is responsible for overseeing the prudential aspects of the Solvency II framework, and the FCA and the TPR when it comes to pensions. The FCA also regulates some aspects of Solvency II. However, particularly when it comes to national and local institutions, it is HMT that will be central to the discussions, and they are discussed further in future chapters.
Solvency II
One of the most important regulatory schemes for insurance firms in the UK is Solvency II, a regulatory framework for insurance and reinsurance, enacted in the European Union and which came into force in 2016. It applies to all EU member states, as well as the United Kingdom, which enacted Solvency II in domestic law as a statutory instrument in 2019 following the UK’s departure from the EU.84HMG, The Solvency 2 and Insurance (Amendments etc.) (EU Exit) Regulations 2019. 2019 No. 407. Link.
The Purpose of Solvency II
Solvency II was intended to harmonise prudential regimes throughout Europe. The UK was already operating under a risk-based regime prior to the introduction of Solvency II: Pillar 2 of Solvency I known as the Individual Capital Assessment was a risk-based regime. In pursuing harmonisation, though, Solvency II created an average framework that did not necessarily work effectively for the UK market.
In essence, Solvency II creates tools by which firms can balance policyholder protection with other responsibilities.
Solvency II operates with 3 pillars, described thus by the European Commission:
- Pillar 1 sets out quantitative requirements, including the rules to value assets and liabilities (in particular, technical provisions), to calculate capital requirements and to identify eligible own funds to cover those requirements;
- Pillar 2 sets out requirements for risk management, governance, as well as the details of the supervisory process with competent authorities; this will ensure that the regulatory framework is combined with each undertaking’s own risk-management system and informs business decisions;
- Pillar 3 addresses transparency, reporting to supervisory authorities and disclosure to the public, thereby enhancing market discipline and increasing comparability, leading to more competition.85European Commission. Solvency II Overview: Frequently Asked Questions. 12 January 2015. Link.
Solvency II requires firms to invest according to the ‘Prudent Person Principle’ (PPP) – the PPP has three general objectives underlying it:
- The firm must only invest in assets and instruments the risks of which it can properly identify, measure, monitor, manage, control and report and appropriately take into account in the assessment of its overall solvency needs;
- All the assets of the firm must be: (a) invested in such a manner as to ensure the security, quality, liquidity and profitability of the portfolio of assets of the firm as a whole; and (b) localised such as to ensure their availability; and
- In the case of a conflict of interest, the firm must, or must procure that any third party which manages its assets will ensure that the investment of assets is made in the best interest of policyholders.86Hymans Robertson, Solvency II: Prudent Person Principle. 2016. Link.
Under the previous Solvency I regime, there were no rules preventing investment in specific assets, however only some ‘admissible assets’ could count towards capital requirements.87Clifford Chance, Investments by Insurers under Solvency II. Briefing note, Asset management and funds. May 2016. Link. As a result, the majority of assets held by insurance firms were ’admissible assets’. The ‘admissible asset’ concept has been replaced in Solvency II by the ‘Prudent Person Principle’ (PPP)88, which determines the appropriateness of a specific investment strategy relative to the insurance business it is backing. The distinction between admissible and non-admissible assets no longer exists but instead is context specific for insurers.
Additionally, insurers must calculate a “Solvency Capital Requirement” (SCR) buffer, and use quantitative and qualitative tools to assess the underlying risk of the insurance portfolio. This buffer is to ensure that policy holders are protected and that insurers have the assets necessary to meet their liabilities under extreme stress events89The Solvency Capital Requirement requires insurers to hold a capital buffer to protect against losses occurring over the next year with 99.5% confidence – equivalent to protecting against a 1-in-200 year event. SII Regulations, Art. 101(3) of the Solvency II Directive.
The Matching Adjustment has stricter rules for investments, since it relates to the valuation of long-term, illiquid liabilities where there is a compelling interest for firms to be sufficiently protected to ensure fixed insurance products like (but not limited to) annuities can be paid out regularly. The equivalent to the Matching Adjustment under Solvency I could be applied to all assets, calculated using actuarial judgement, rather than prescriptive rules. That is no longer the case in Solvency II.
Finally, there is the risk margin, which is the difference between an insurers best estimates of liabilities and the (often unobservable) market value of liabilities. 90HM Treasury, Review of Solvency II: Consultation. April 2022. Link. It is used to ensure that, in the event of financial difficulty, an insurance company holds assets equivalent to the amount necessary to transfer liabilities to a third party. 91Ibid.
Solvency II is thus a robust regime, but in some key ways it should be reformed to better balance policyholder protection and other important goals such as growth and competitiveness. Indeed, the PRA itself noted that the Solvency II review it is undertaking is aiming to support insurers’ ability to invest for “long-term growth, and facilitate a thriving, competitive and safe UK insurance sector”.92PRA. DP2/22 – Potential Reforms to Risk Margin and Matching Adjustment within Solvency II. 28 April 2022. Link.
Unfortunately, so far reforms have proceeded slowly, and there are some areas where the Government and the regulator have shown less ambition than would be desirable. Indeed, there are some areas, such as re-examination of Solvency Capital Requirements, where the EU has announced reforms before the UK has even begun to consider them.
This chapter looks at specific areas where reform could make a material difference to the UK’s investment landscape, including those where reform is being considered
- The Risk Margin
- The Matching Adjustment and Fundamental Spread
Others where reforms are not currently being considered, such as
- The Prudent Person Principle
- Rating Illiquid Assets
- Changes to the Solvency Capital Requirement
This chapter then looks more broadly at how to make the regulatory landscape more growth friendly, and ensure that rules designed to protect policy holders and pension scheme members continue to balance that need with the important goals of promoting growth and competition.
The Risk Margin
The risk margin is one area where reform is broadly agreed between the industry and Government. The risk margin, as defined by the Treasury as the “difference between an insurer’s best estimates of its liabilities and the market value of its liabilities”. It is designed to ensure that, in the event of financial difficulty, an insurance company holds assets equivalent to the amount needed to transfer liabilities to a third party.
The risk margin for life insurance in 2021 was larger than £32 billion.93Ibid.
The issue currently is that the existing methodology for calculating the risk margin requires an excessive amount of capital to be held and involves a relatively high degree of volatility, particularly in low interest rates environments. This is the result of the need to use a proxy method to calculate the risk margin, known as the “cost-of-capital” method. Almost as soon as this method was introduced, the industry realised that “the risk margin was both larger than expected and very sensitive to interest rate movements.”94Pelkiewicz et al. A review of the risk margin – Solvency II and beyond. Institute and Faculty of Actuaries, Discussion Paper. British Actuarial Journal. 2020. Link.
The Government has signalled its intention to move to a modified cost-of-capital approach. This would bring the UK in line with proposed reforms in the EU, which would in particular benefit firms which operate in both jurisdictions.95HM Treasury, April 2022.
Moreover, the current calibration of the Risk Margin has resulted in some insurers deliberately reinsuring risk in jurisdictions that are not subject to Solvency II. More broadly, this shifts risk in the UK market from longevity risk to credit risk.
To quote the British Society of Actuaries
The increased use of reinsurance does mean that the success or failure of an annuity writer is now predominantly driven by how well it manages its assets. This is a stark change from the traditional role of life insurers, which was to manage insurance risk.96Pelkiewicz et al. 2020
Government Risk Margin Proposals
The Government proposes a reduction of the risk margin of 60% to 70% by using a modified cost of capital approach. This alone could potentially unlock between £24.4 and £27.3 billion in life and non-life insurance, using the amount currently held in risk margin capital.97Relative to the £32 billion currently held in the risk margin. This in itself would be a welcome change.
Pelkiewicz et al. noted that a “more fundamental re-think” may be needed. It should be noted that when the Association of British Insurers considered this question, they considered a 75% reduction in the risk margin “optimised for the UK”.98KPMG, Report on economic impacts of potential changes to insurance regulatory framework in response to HM Treasury Review of Solvency II: Call for Evidence. Association of British Insurers. February 2021. Link. In that context, a 60% to 70% reduction in the risk margin using the same fundamental approach is somewhat unambitious. Furthermore, the potential release of capital is calculated before the impact of transitional measures on technical provisions (TMTPs), which will act to offset the majority of the release for large firms.
There are other approaches to calculating the risk margin that have also been explored. In particular, the Margin over Current Estimate (MOCE) approach would help achieve Solvency II Equivalency (like a modified cost of capital approach) since it is being developed by the International Association of Insurance Supervisors, and could involve a simple calculation. A prudence based MOCE, which adds a margin to best estimate uncertainty, would involve using international capital standard (ICS) risk charges and adding a small margin. This has the potential to reduce administrative burdens. It would also conform to international approaches.
In any case, it is desirable that Government is changing the risk margin, but this could go further still, and more capital could be unlocked than what is currently proposed. This is particularly the case given current proposals in relating to the Matching Adjustment (MA) and the Fundamental Spread (FS).
Matching Adjustment and the Fundamental Spread
Changes to the risk margin are to be welcomed, but these are undermined by the Government’s proposals to change the matching adjustment and fundamental spread at the same time, which evidence from Willis Towers Watson suggests will make it harder to invest in alternative assets.99Willis Towers Watson. Analysis of Proposed Solvency II Reforms. 21 July 2022. Link. The PRA proposals risk hindering the wider government thrust for investment in productive assets.
The Matching Adjustment is a tool by which insurers can realise some of the liquidity premium on their investments in liability valuations. This means that insurers are required to hold less capital than they otherwise would have.100PRA. DP2/22 – Potential Reforms to Risk Margin and Matching Adjustment within Solvency II. 28 April 2022. Link. It is alternatively described by the PRA as a way insurers can recognise capital resources up-front to invest.101Ibid. It is not, however, ‘free money’ as insurers must maintain the proper risk practices when investing.
The PRA asserts that in its current form the matching adjustment does not adequately reflect risk because of the way the Fundamental Spread (FS) is calculated. The FS is designed to take into account the cost of default and downgrades when the matching adjustment is calculated.102Actuarial Post, Solvency II Fundamental Spread: Annuity prices remain steady. 2015. Link. The PRA argues that, currently, there are three major concerns:
- The FS does not capture all retained risks which insurers face and as such its level (in basis points) is generally too low;
- The FS is not sensitive to differences in risks across asset classes for a given currency, sector and Credit Quality Step (CQS); and
- The FS does not adjust to reflect structural shifts in the credit environment over time, unless there are actual defaults or downgrades.103PRA, 28 April 2022.
To quote the Deputy Governor for Prudential Regulation, in a speech he gave at a Bank of England Webinar in July of 2022,
“…our experience of operating the MA suggests to us that the broad mechanism works but that the EU design makes insufficient allowance for uncertainty, the difference in riskiness between assets, and signals from the market. As a result of this, we are concerned that it over-estimates the portion of future returns which can confidently be assumed to be free of risk for insurance companies and therefore safely banked as capital up-front.”104Woods, Sam, Solvency II: Striking the balance – speech by Sam Woods. Bank of England/PRA. 8 July 2022. Link.
Risk Margin and Matching Adjustment Reform Potentially At Cross-Purposes
The risk here is that the fundamental spread reforms will undermine the broader thrust of reforms. A newly calculated fundamental spread would significantly decrease the value of the matching adjustment and the ability of insurers to recognise liquidity premiums. To put the risk margin and capital adjustment in context, as stated previously the risk margin amounts to slightly under £40 billion, while the PRA estimates that the current matching adjustment constitutes a benefit of around £80 billion, or twice as large.105Ibid. Indeed, Woods notes that ”for a number of insurers the MA by itself makes up the bulk of their capital.”106Ibid.
There is disagreement currently between the industry and the PRA in terms of the proposed changes to the fundamental spread. The Association of British Insurers are clear: “the current proposals would not achieve the suggested release of 10 to 15% of capital for re-investment”.107ABI, Solvency II reform proposals need further work to meet objectives. 21 July 2022. Link.
There are two particular concerns that have been raised with Policy Exchange and which should be taken into account in terms of further discussions
- A lack of evidence in relation to the inadequacy of the current fundamental spread calculations
- A failure on the part of the PRA to consider the market conditions of various asset classes (particularly productive assets)
A Relative Lack of Evidence
The PRA has indicated support for changes to the matching adjustment. The MA is a key part of the Solvency II framework. It is to be praised that the PRA and Government are ready for conversations in relation to the MA, but even more ambition would be welcome.
The PRA states in an Annex to its discussion paper that it had considered papers that did not support proposed changes to the Fundamental Spread, but that these papers either did not “use data relevant to the UK life insurance market” and were, in other ways, not providing data that could be used directly.108PRA, Solvency II Review: Matching Adjustment and Reforms to the Fundamental Spread. 2022. Link. This is somewhat undermined though by the PRA including evidence that did in fact rely on a similar basis, though reaching the PRA’s preferred conclusion, that the PRA did use.109ABI
Given the PRA’s own internal assumptions of how significant this change to the Fundamental Spread will be, the PRA should be prepared to develop a stronger evidence base before proceeding with these reforms. This call for raising the burden of evidence is especially the case for reforms which seek to introduce an element of pro-cyclicality, and hence systemic risk, into an otherwise counter-cyclical framework.
Recommendation 1: Government should proceed with Solvency II reform but should take care to ensure that any changes lead to investment in productive assets. Currently, there is a worry that the current approach to Solvency II reform may not deliver changes needed or desired by either the Government, industry or regulators. While significant progress has been made, Government should continue dialogue and seek to ensure the best outcome from reform, especially in relation to the risk margin, the fundamental spread and the matching adjustment.
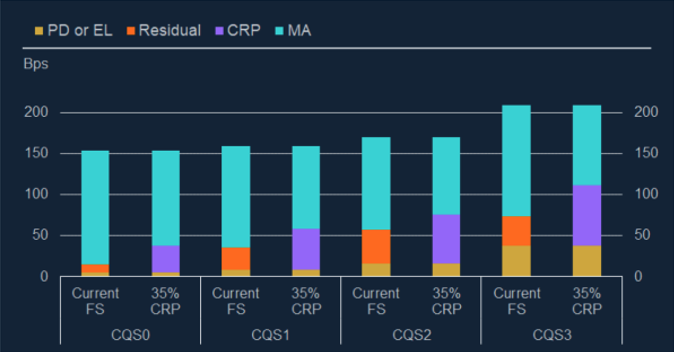
Bank of England Solvency II Discussion Paper, Technical Annex
Furthermore, as the ABI alludes to in its response to the discussion paper110ABI, PRA Discussion Paper DP2/22 – Response from the Association of British Insurers (ABI). 21 July 2022. Link., the current framework is designed to withstand the scale of loss seen in the 1930s Great Depression. The COVID-19 pandemic resulted in an economic shock of that scale, though with a more appropriate monetary and fiscal response; the current MA and FS facilitated this. In that context, it would seem sensible for the PRA to establish a very high evidentiary basis indeed for any changes to the Fundamental Spread.
Market Conditions of Various Asset Classes
The other difficulty in the PRA’s current position is that changes to the Fundamental Spread would be used for assets that are the centre of the investment discussion in the UK at the moment: productive assets.
These are often assets, such as net zero investments, venture capital, more volatile private equity, and infrastructure which by definition are harder to assess risk on. The markets are necessarily less liquid, regulated and in some cases the markets are remarkably novel. Investors are therefore highly sensitive to regulation, as investors already have to do a significantly larger amount of risk assessment to pursue these investments.
In both this investment context, and the broader policy context around productive assets, it is vital to take the nature of the asset markets under discussion into account. However, at times the PRA has avoided these questions.
For example, in a recent speech on Solvency II reform, the Deputy Governor used two bonds as an example of where the current Fundamental Spread may not be providing adequate protection.111Woods, Sam. Solvency II: Striking the Balance. 8 July 2022. Link. The Deputy Governor suggested that two bonds – one which pays interest at 5% and one at 2% actually are likely to have different risk profiles, and that therefore the current rules, where the 5% bond can generate MA of 3.5% compared to .5% with the 2%, are likely too generous. As such, the PRA believes that the market is clearly indicating something about risk and returns that is not accommodated by the MA since the MA is too generous.
The PRA’s position here may well have a point, insofar as there is a degree of uncertainty as to which element of the return is necessarily risk. But this can go the other way as well – there may well be market conditions that do determine the different interest rates for the two kinds of bonds.
Moreover, one of the main thrusts of the Solvency II reforms in the UK has meant to be investing in more complex, innovative and productive assets. Many of these assets operate in less liquid, smaller and sometimes less developed markets. As such, bonds may not be the most useful or relevant example to discuss changes to the Matching Adjustment. Indeed, one of the issues with the current regime is that it does not take into account the specific risk factors in relation to illiquid assets.112PWC. Solvency II Review: Rethinking the Fundamental Spread. March 2022. Link. That is not to say that bonds are not an important example in terms of the Matching Adjustment, but rather that by using the bond example the PRA may have inadvertently obscured the extent to which Matching Adjustment reform is vital in a broader range of asset classes. Rather, there should be more focus specifically on how productive assets can be included in the Matching Adjustment, and how UK insurers can shift more of their portfolios in this direction.
Rating Productive Assets
When insurance firms invest in illiquid assets without a credit rating issued by an External Credit Assessment Institution (ECAI), they are required to undertake an internal rating process in order to assign a Credit Quality Step (CQS). This process is governed in the UK by the PRA’s Supervisory Statement SS3/17, Solvency II: Illiquid unrated assets. This CQS is then used to calculate the Matching Adjustment for that particular asset.
As the PRA states in SS3/17, when an ECAI is able to rate an asset, the procedures after are relatively straightforward. However, many otherwise investable forms of asset, such as private lending to start-ups/SMEs, new technologies including some infrastructure projects, etc. find it difficult to obtain an ECAI rating for many reasons.
The PRA states that, in relation to internally rating productive assets:
The PRA’s view is that the CQS to which an internal credit assessment maps lie within the plausible range of CQSs that could have resulted from an issue rating given by an ECAI. Broad consistency between the CQSs resulting from firms’ internal assessments and ECAI issue ratings will help to give the PRA assurance that the FS resulting from the assigned CQS and sector is appropriate.113PRA. Supervisory Statement SS3/17: Solvency II: Illiquid unrated assets. April 2020. Link.
In this text, the PRA is in effect seeking to ensure that a CQS mapped to an internal rating is similar to the CQS which would have been mapped onto a rating given by an ECAI. However, if the assets themselves are not subject to an ECAI, particularly if the asset is innovative, it becomes very difficult to assess whether or not an internal rating can map onto an ECAI. This can make it prohibitive to invest in certain innovative asset classes. Given this difficulty, it is worth reflecting on what the EU has noted in relation to ECAIs, namely the need to “alleviate any mechanistic overreliance of the credit risk rules on external assessment”.114Joint Committee of the European Supervisory Authorities. Final Report: Draft Implementation Technical standards amending Implementing Regulation (EU) 2016/1800 on the allocation of credit assessments of external credit assessment institutions to an objective scale of credit quality steps in accordance with Directive 2009/138/EC. 28 May 2021. Link.
Regulatory Uncertainty
In effect, the current regulations make it difficult in practice to invest in unrated assets, and for each particular unrated asset (of a specific type), the PRA requires new approval. This is because the PRA is looking for, in essence, proof that the internal rating is consistent with an ECAI, which is difficult to prove without an ECAI to begin with. For example one of the conditions the PRA imposes on firms is that
The PRA expects to see evidence that the credit rating methodology and criteria development and approval, credit assessment and CQS mapping have been performed by individuals with relevant asset-specific credit risk expertise and competency, who are independent and with minimised conflicts of interest, be they internal or external to the firm.115Ibid.
This is vague language that is difficult to prove. In a similar vein, in Supervisory Statement 7/18, regarding the Matching Adjustment, the PRA notes simply that “the PRA expects firms to be able to demonstrate the appropriateness of any internal rating model used”, and that it be “broadly consistent with” ratings if they had been produced by an ECAI.116PRA, Supervisory Statement SS7/18 Solvency II: Matching Adjustment. July 2018. Link. This lack of clarity makes it more difficult for firms to have certainty in which assets are investable. This is not only in terms of assessing the opportunity cost of a regulatory process to confirm the eligibility of certain assets. Moreover, many of the assets themselves, especially innovative assets, require shortened investment assessment periods since they are highly competitive.
The PRA would assist firms if they could spell out more explicitly how to including innovative assets in the matching adjustment, and use a principles-based approach to make it easier to rate assets in future supervisory statements. This would increase transparency ensuring firms have clearer expectations. Moreover, the PRA could make more transparent and clear the expectations for internal rating models, especially for innovative assets without an ECAI to compare to.
The Government’s Solvency II consultation includes proposing an acceleration of eligibility decisions for less complex assets. The Government could show more ambition by aiming to accelerate assessment for complex assets as well, recognising that complex assets are those most likely to be the target of the Government’s growth ambitions and also more likely to be caught in the relatively vague nature of current supervisory statements. By encouraging an up-front assessment of internal rating models, rather than a streamlined judgement process, that still leaves the PRA in the driver’s seat.
Recommendation 2: The PRA should publish transparent criteria for the acceptability of internal rating models relative to ECAIs. Furthermore, the PRA could include transparent criteria for eligibility in the MA for most asset classes and accelerate eligibility decisions for more complex assets. The PRA should work with industry to develop transparent assessment criteria for complex assets also.
Eligibility for the Matching Adjustment
Related to, but separate from, the issue of rating assets in general is the issue of MA eligibility. The eligibility process for MA assets is binary. Firms are required to demonstrate that the MA portfolio are “fixed in terms of timing and amount, and cannot be changed by the issuers of the assets or any third parties.”117Ibid.
This would exclude productive assets, like property or floating rate infrastructure. For instance, the Matching Adjustment does not allow inclusion in the Matching Adjustment assets which are not fixed but for which this is reflected in a risk-adjusted change in cashflows. That is, if a rental cashflow were to be haircut for the inclusion in the Matching Adjustment, it would still not be eligible since the underlying asset is not fixed. However, the Government has been relatively vague about how requirements might be eased.
Clarity is vital when it comes to eligibility for the Matching Adjustment, since it is a major determinant of whether or not a firm will invest in a particular asset. For example, while ratings are an administrative issue for insurers, firms may not even move to rating or considering an asset if it is not eligible for the MA.
Moreover, the eligibility conditions for the MA are not fixed with specific asset classes. SS7/18 makes clear that “there is no prescribed ‘closed list’ of eligible assets”, and that the PRA reviews “each asset portfolio on a case-by-case basis”.118Ibid. This inherently creates a high degree of judgement and a certain lack of clarity, alongside a potentially high-stakes binary result for inclusion in the MA.
The issue is that this judgement turns on one question: whether a cashflow is fixed or not fixed. Even if there is a high degree of certainty in cashflows, if there is even a small degree of uncertainty the asset is not eligible. This is particularly a problem for productive assets. For example, the majority of the infrastructure market uses floating rate loans to finance projects.119Schroders. Infrastructure financing: An overview. March 2017. Link. These would automatically be excluded from the MA even though insurers could take steps to price in risk.
Using the Prudent Person Principle
To improve clarity, Government should consider looking to other principles in Solvency II that might assist in developing more transparent criteria for eligibility, while maintaining fixity of cash flows at the portfolio level. This was raised by PWC in its paper on this subject.120PWC. Solvency II Review: Rethinking the Fundamental Spread. March 2022. Link.
The PRA does already hold firms to a higher standard in relation to the Prudent Person Principle (PPP). In this context, one way to ensure assets are more readily eligible for the MA would be to use the Prudent Person Principle to so long as firms are upholding their prudential responsibilities. This would also help meet the Government’s desire to make it easier to invest in complex assets, as laid out in the Consultation.121HM Treasury. Review of Solvency II Consultation. See 4.13 and 4.14 The PRA states in Supervisory Statement 1/20 (SS 1/20), that
Non-traded assets are often bought and sold less frequently than traded assets or in less deep, liquid and transparent markets. Therefore, there is often relatively little credible historical pricing data that can be used to measure the risks they introduce as required under Investments 2.1(1). Firms with historical records for their own assets are unlikely to have access to historical data relating to the market as a whole. It is therefore important for firms to undertake a fundamental analysis of the underlying risks on their non-traded assets.122PRA, Solvency II: Prudent Person Principle, SS1/20, May 2020. Link.
This indicates that the PRA already expects firms to have undertaken a high level of analysis on the innovative assets in question. Furthermore, the PRA will expect firms to assess “in the case of internally-rated assets, the robustness, capability and maturity of the internal rating framework”123Ibid..
This could include provisions to ensure that, for assets that may not have fixed income, insurers would be required to take a risk-adjusted “haircut” to what they can include in the Matching Adjustment. This would ensure that risks are managed in a prudent way, but would expand what would be eligible for the MA.
Moreover, SS 1/20 also states that “assets not admitted to trading on a regulated financial market” need to be kept at “prudent levels”. These terms are not defined as such, and so firms are less able to plan and invest appropriately.
Perhaps to underline the degree to which the Prudent Person Principle is difficult to interpret, there is disagreement within the industry over whether it should be applied at the asset level or at the portfolio level – related Supervisory Statements do not clarify one way or the other. That a fundamental principle of application can be so widely interpreted demonstrates the extent to which there is scope to clarify the PPP.
The Chicken and Egg Problem
In that context, the PRA should consider, in its pledge to reduce bureaucracy, to move to a regulatory framework where insurance firms are monitored on the robustness of their internal procedures, rather than the particular qualities of each individual asset class. Currently, firms face a chicken and egg problem. Firms are not able to approach the PRA until they have a potentially investable asset. Given the extent of the regulatory burden to invest in the said asset though, firms are deterred from going through the process in the first place.
The PRA could therefore use the Prudent Person Principle to develop transparent criteria for how robust and credible internal rating models are required to be, and what data is required to confirm the validity of internal rating models to include assets in the MA. This should be completed in consultation with the Treasury and industry.
An example of how to use the Prudent Person Principle in a clear, usable way can be found in the Danish FSA’s guidance on alternative investments in light of the prudent person principle.124 Government of Denmark. Guidance on alternative investments and sound investment processes in light of the prudent person principle. GUI No. 9516 of 27 June 2018. Link. Compared to the PRA’s supervisory statement on the subject, the Danish guidance includes a much higher number of ‘must’ statements (16 in the PRA’s statement, 65 in the Danish guidance), it includes specific examples of how the PPP sets expectations for firms in different alternative asset classes, and how these expectations might differ by alternative asset class, and it lays out clearly what competencies the board must have in making decisions in the form of various examples.125 Ibid. See pg. 7 of the guidance for particular examples. Most remarkably, it includes a mock ‘structured process’ by which it would typically expect firms to manage alternative investments from initial assessment to post-investment. Obviously, there are other factors at play, but it is probably not surprising that Denmark, out of the 10 largest insurance markets in Europe covered by Solvency II, has by far the highest proportion of assets invested in alternatives.126 See appendix 2.
Using the Prudent Person Principle as the basis, and bearing in mind the need to mitigate against risk, and the constant requirement to match policyholders via cashflow matching, the PRA and Government could consider a regulatory framework where firms could be assessed on the robustness of their internal methodologies and rating systems prior to investment in a particular asset and their inclusion in the MA, rather than assessing at length innovative assets per se. In short, firms could model hypothetical scenarios grounded in a fundamental assessment of the underlying risks of given asset classes before identifying a particular asset to invest in. This would allow firms to internally rate assets and therefore more expeditiously invest in alternative assets.
Recommendation 3: Government should work with regulators to develop a transparent, holistic and applicable test for Prudent Person Principle, which could enable investment in alternative assets. This should be aimed at ensuring that firms have the correct procedures in place to invest in innovative assets, rather than requiring a specific test every time a new innovative asset is considered for the matching adjustment.
Not Missing a March: Solvency Capital Requirements
The other piece currently missing in the discussion related to Solvency II reform in the UK is the change to the Solvency Capital Requirement. The Solvency Capital Requirement is the amount of capital that insurance companies are required to hold to maintain 99.5% confidence that they could survive losses. Different kinds of investments attract different SCRs. The current SCRs for both the UK and the EU according to the ‘Standard Formula’ are
- Long-Term Equity – 22%, with no symmetric adjustment (SA)
- Real Estate – 25% + SA
- Qualifying Private Equity – 39% + SA
- Equity Funds – 39% + SA
- Infrastructure equity – 30% + 70%SA127Jiang, Ziling and Drukier, Gilles. Unlocking Long-Term Equity. Neuberger Berman. February 2021. Link.
The current SCRs are seen as restrictive, and the European Insurance industry has indicated its strong desire to see regulations change.128Insurance Europe. Solvency II Review and Insurance Recovery and Resolution Directive (IRRD). 14 February 2022. Link. In particular, there is a desire to make the symmetric adjustment optional for equity risk and to make the current Long-Term Equity category less vague.129Ibid. As with some of the PRA’s own supervisory statements, the Long-Term Equity definition in regulations is one that is difficult to interpret and establish criteria for, and difficult for non-life insurers to meet.130Jiang and Drukier, 2021.
The European Commission has proposed changes to the LTE in its 2020 opinion which would examine LTE assets in a wider portfolio for the purposes of assessing the holding period, not just individual holdings, would no longer have to be ring-fenced, and LTE assignment would no longer need to be maintained over the lifetime of the insurance obligations.131EIOPA. Opinion on the 2020 Review of Solvency II. 17 December 2020. Link. The European Commission published its proposals on September 2022, which specifically would make it easier to invest in Long-Term Equity.132European Commission. Questions and Answers: Proposals for Amendments to the Solvency II Directive and a new Insurance Recovery and Resolution Directive. 22 September 2021. Link. Analysis of these changes specifically expects small and medium-sized businesses to benefit from easier access to capital funding via changed Long-Term Equity rules.133European Parliament. Initial Appraisal of a European Commission Impact Assessment. April 2022. Link.
Despite the European Union’s commitment to looking at these particular regulatory issues, neither HMT nor the PRA have displayed any appetite on these questions. The Solvency II Review does not mention Long-Term Equity qualification, nor does it mention the Solvency Capital Ratio in any context other than that related to the Fundamental Spread and breaches of the Matching Adjustment.134HM Treasury. Review of Solvency II: Consultation. April 2022. Link. This is peculiar both because
- The European Union, not always a nimble regulator, has shown more appetite for greater capital release for businesses than the UK
- The UK suffers from a particularly acute problem with long-term growth investment135Scaleup Institute. The Future of Growth Capital. August 2020. Link.
Furthermore, organisations such as the British Property Federation have themselves called for a decrease in the SCR for real estate assets, reflecting their long-term risk profile.136British Property Federation. BPF Calls for Reform of Solvency II Regulation. 25 July 2022. Link. Again, this has not been reflected in the broader conversation, nor in where the regulators are currently. Given the UK’s significant dearth of housebuilding, reforms along these lines would deal with some of the UK’s fundamental challenges.
At the very least, the UK should use this Brexit opportunity to be more ambitious than its European Union counterparts in all areas, including Solvency Capital Ratios and Long-Term Equity eligibility. This approach should equally apply to insurers which use the Standard Formula, and firms who calculate capital using a bespoke Internal Model.
Recommendation 4: Government and regulators should be more ambitious in reducing and simplifying Solvency Capital Requirements as part of Solvency II reforms. At the very least, the UK should aim to match the European Union in terms of reforms to the Long-Term Equity eligibility requirements, and it should look seriously at reducing the SCR for real estate investments. This will help secure long-term funding for businesses and development.
Regulatory Perspectives
More broadly than any specific recommendations, it is important that regulators have an approach that encourages growth and competition.
Currently, the PRA has the following statutory objectives:
- to promote the safety and soundness of regulated firms
- to contribute to the securing of an appropriate degree of protection for policyholders (for insurers).
- to facilitate effective competitions between firms. (secondary objective)
The Financial Conduct Authority has the following statutory objectives:
- securing an appropriate degree of protection for consumers.
- protecting and enhancing the integrity of the UK financial system.
- promoting effective competition in the interests of consumers in the markets137HM Government. Financial Services and Markets Act 2000. Link.
In the Future Regulatory Framework Review,138HM Treasury. Financial Services Future Regulatory Framework Review. Response to Consultation. July 2022. Link. Government stated its intention to include further a secondary statutory objective for growth and competitiveness for both the PRA and the FCA.139HM Treasury. Financial Services Future Regulatory Framework Review: Proposals for Reform. November 2021. Link. This commitment has been transferred into the Financial Services and Markets Bill, as the following:
The competitiveness and growth objective is: facilitating, subject to aligning with relevant international standards— (a) the international competitiveness of the economy of the United Kingdom (including in particular the financial services sector), and (b) its growth in the medium to long term.
This language is welcome, as it recognises the financial sector’s long-term growth and its role in terms of the UK economy.
However, it is worth noting that the PRA already has a secondary objective to facilitate ‘effective competition’, and this has been met with scepticism by some staff because it is explicitly not on par with the other two statutory objectives.140Bank of England, Evaluating the PRA’s approach to its Secondary Competition Objective. March 2016. Link. There was a reported view that the secondary competition objective was viewed by some as incompatible with the primary objectives.141Ibid. Moreover, there is a widespread view within industry that the current secondary objective really is secondary, and is sometimes an afterthought when it comes to making regulatory decisions. Indeed, the Governor of the Bank of England confirmed as much in a speech in December 2021: primary objectives take “pole position”.142Bailey, Andrew. Reforming Solvency II: Delivering policyholder protection – speech by Andrew Bailey. 1 December 2021. Link.
Indeed, the Treasury Select Committee recommended in 2016 for the PRA to be given a primary competition objective specifically so that this objective “could carry as much weight as its solvency objective”.143House of Commons Treasury Select Committee. The Solvency II Directive and its impact on the UK Insurance Industry. 25 October 2017. Link. In any case, competition has remained a secondary objective, and since 2014 the number of retail annuity providers on the open market has fallen by almost two thirds – from 13 to 5.144Duncan Smith et al. Taskforce on Innovation, Growth and Regulatory Reform. May 2021. Link.
As such, this section argues that growth should become a primary objective, international competitiveness should remain a secondary objectives and, in the case of both the PRA and the FCA, both regulators should publish a specific strategy document explicitly stating how they intend to balance the secondary objectives with the primary objectives after consultation with industry. In order for growth and competitiveness objectives to have effect, there must be a genuine attempt to make them part of the decision-making process and, in the case of the growth objective, give it equal weight to other objectives.
Ensuring A Regulatory Shift
The fact is regulatory decisions are invariably influenced by culture, and in terms of the PRA, there should be genuine concern that secondary objectives may not be given the due regard they require.
Indeed, there has already been scepticism expressed about the inclusion of the new secondary objectives. As the current Governor of the Bank of England145Then Chief Executive of the FCA put it in 2019: “the Financial Services Authority (FSA) was required to consider the UK’s competitiveness, and it didn’t end well, for anyone including the FSA.”146Bailey, Andrew. The future of financial conduct regulation. 23 April 2019. Link. This is a pithy and thought-provoking reply, but it requires some qualification.
For example, the FSA did not have a financial stability objective included until 2010.147HM Government. Financial Services Act 2010. April 2010. Link. The FSA’s integrated supervisory model was sup-optimal too, and it “failed to strike the right balance between prudential supervision and conduct of business supervision”.148Ferran, Eilis. The Break-up of the Financial Services Authority. 10 April 2011. There were significant structural weaknesses in how the FSA carried out its functions.
The ‘twin-peak’ model adopted after the demise of the FSA in 2012 was a significant positive development in terms of risk management, and thus the comparison to the FSA is not necessarily the most apt.
Finally, balancing potentially competing objectives need not necessarily require jettisoning the very real imperatives of maintaining protection for consumers and policyholders. Indeed, at times they are mutually reinforcing.
In the UK, this was shown in relation to the problems that emerged in the LDI market, explored in the last chapter. The LDI strategy pursued by large portions of the defined benefit pension community risked systemic insolvency by relying unduly on one asset class (bonds), as well as a relatively small number of dealers and firms,149Zijdenbos, Eric. Liability-Driven Investment (LDI) and the UK Pension Fund Problem. 29 September 2022. Link. that were assumed to be relatively risk-free. From a European perspective, UK funds use a small group of actuarial consultants, meaning many plans had the same risk characteristics.150Ibid. Its notable that the previous Chief Executive of the FCA underlined the fact that any competitiveness objective should not “entrench certain business models”.151Bailey, Andrew. The future of financial conduct regulation. 23 April 2019. Link. Yet, by perhaps not focusing on competition and competitiveness enough, the FCA and TPR might have inadvertently encouraged a strategy that posed a significant risk to consumers and indeed the wider financial system. This is not an issue where the PRA was directly involved, and indeed suggests that ensuring balance is an important goal across financial regulation.
Secondly, international experience shows that it is possible to balance concerns such as competitiveness and growth with very successful regulatory records. In this case, Australia and Canada show how flexible regulators can still adequately balance competing objectives while maintaining a clear focus on financial stability.
Competing Objectives: Experiences from Other Jurisdictions
Australia and Canada offer two excellent examples because both countries have competition-oriented regulators, strong pension and insurance markets and have exemplary records for financial stability over the last two decades. In particular, the regulatory record leading up to the financial crisis in 2008 was significantly better.152Stevens, Glenn. Australia and Canada – Comparing Notes on Recent Experiences. Canadian Australian Chamber of Commerce. 19 May 2009. Link.,153Baker, Caner. How do mega-bank merger policy and regulations contribute to financial stability? Evidence from Canada and Australia. 5 April 2017. In Canada, financial institutions are regulated by the Office of the Superintendent of Financial Institutions (OSFI), and in Australia financial institutions are regulated by the Australia Prudential Regulatory Authority (APRA).
Yet, despite their reputations for stability, both institutions take a more explicit view than the PRA and FCA that their objectives in this regard must be balanced against other considerations, such as competitiveness and growth.
For example, APRA states that its prudential objective is clear: “the financial safety of institutions and the stability of the Australian financial system”.154APRA. Information Paper: APRA’s objectives. 11 November 2019. Link. However, APRA is also explicit that this objective is modified by the APRA Act, which states clearly that “APRA must balance other desired objectives of efficiency, competition, contestability, and competitive neutrality”155Ibid. APRA is also clear that its objectives are interlinked – “sometimes they can be mutually reinforcing, at other times, a balance between competing interests needs to be found”.156Ibid.
In Canada, OSFI’s mandate explicitly requires it to take a “balanced approach”, and that the regulator is required to have “due regard for the need to allow financial institutions to compete effectively and take reasonable risks”.157OSFI. OSFI Structure and Operations. 4 April 2022. Link. The enabling legislation goes further, saying that OSFI’s regulatory functions “must be carried out having regard to the fact that boards of directors are responsible for the management of financial institutions, financial institutions carry on business in a competitive environment…and financial institutions can experience financial difficulties that can lead to their failure.”158Government of Canada. Office of the Superintendent of Financial Institutions Act. 1985. Link.
OSFI is therefore explicit about its goal: “to balance competitiveness with financial stability”.159OSFI. About us. 26 April 2022. Link.
The PRA on the other hand takes a comparatively attenuated approach to its current secondary objectives. In its latest policy statement, the PRA has stated that they “will consider the potential for conflict between the primary and secondary objectives and aim to balance the different considerations”.160PRA. The Prudential Regulation Authority’s approach to policy. Discussion Paper, DP4/22. September 2022. Link. This is not helped by the fact that the statutory objective in question – to “facilitate effective competition” is relatively passive, compared to the need to “promote” safety and soundness. In its business plan from 2022/23, the PRA does indicate that it must “balance its primary and secondary objectives, but specifically in relation to achieving its strategic priorities,161PRA. Prudential Regulation Authority Business Plan 2022/23. 20 April 2022. but the primary safety and soundness objective is expressed in stronger language. The new growth and competitiveness objective also uses “facilitates”, which again is relatively passive. This offers further reasons why these objectives should be considered strongly.
Therefore, while the PRA does consider its current secondary objectives in its policies, the way it does so may not be as robust as some international peers. This is perhaps the key point to stress in relation to whether the objectives should be primary or secondary – that in any case the growth and competitiveness objectives are adequately balanced by regulators going forward.
The FCA for its part is willing to put in writing that they “want to support long term competitiveness and growth of the UK economy, and know we can do so by being an effective regulator”.162Pritchard, Sarah (Executive Director, Markets). How regulation can prepare the ground for economic growth. 27 August 2022. Link. The FCA also published a detailed consultation paper on its approach to competition, and engages regularly on that topic.163FCA. FCA Mission: Our Approach to Consultation. December 2017. Link. It is worth noting that the FCA’s competition objective is not secondary, but sits alongside its other objectives; another data point indicating that placing objectives alongside each other can ensure a more robust integration of competing priorities.
Separating Growth from International Competitiveness
In short, there may be a genuine question as to whether secondary objectives themselves generate a sufficient shift in outlook in regulation. What is more, growth and international competitiveness may generate different impulses from the regulators given they are in fact quite separate concerns. Growth and competitiveness may in fact sit more uneasily against each other than is suggested by some commentators, and the regulators may have a point in particular that international competitiveness is an objective that should be approached with a certain degree of realism.
Growth is a clear and measurable objective, one where it is relatively easier (though not necessarily easy) to forecast results and the impact of regulation. Moreover, it is an objective that sits remarkably well against the other regulatory objectives, particularly in relation to the need to avoid crises. As Deputy Governor and CEO of the PRA has stated, “the single largest contribution prudential standards can make to economic growth is by reducing the frequency and severity of financial crises.”164Woods, Sam. Growth and competitiveness. 27 October 2022. Link. This is an apt point and one that shows the extent to which growth can sit alongside prudential and conduct standards appropriately, especially in relation to a national economy and the assets in which financial firms might invest. Indeed, in relation to LDI, again, greater investment in productive assets might well have had a positive impact on the overall structural soundness of the market.
Industry has been very clear that in their view growth does not sit necessarily opposed to financial stability. Indeed, in terms of Solvency II and reform of the PRA, the industry has been very clear that its purpose is to “protect people”.165Otudeko, David. Our Industry’s Purpose is to Protect People. 15 December 2021. Link.
However, while growth need not be measured in comparative context, international competitiveness necessarily is. The result, if elevated to a primary objective, is a potential approach driven by factors outside of both the Government’s and the regulators control and in environments where specific conditions might be so different as to make any straightforward comparisons difficult. In fact, the PRA alluded to this in another context when it noted that the EU is reforming Solvency II in part by changing regulations in relation to euro-denominated liabilities, which are much less relevant in the UK market.166Woods, Sam, July 2022. International competitiveness is very hard to measure, and prone to certain ‘copy-paste’ dynamics. There are, for example, reports that the EU is considering copying the UK’s stock listings changes, simply because they make sense and the UK has already done all the work to assess their viability.167Thomas, Helen. A post-Brexit bonanza eludes both the City and the EU. 20 July 2022. Link. While is can be a productive dynamic, it also risks encouraging the regulator being more worried about what is happening in other markets rather than focusing on how to balance competing objectives (which should include growth) in this market. As a result, there is a less strong case to make international competitiveness a secondary objective.
However, this does not vitiate the need for regulators to consider a wider range of considerations and encourage a more transparent statement on balancing objectives per se – something accommodated well by other highly regarded financial regulators. As such, the PRA and FCA should consult on and publish a statement outlining how the secondary objectives are going to be balanced against other prudential objectives, and what mechanisms will be used to establish this balance.
Recommendation 5: Government should make growth a primary objective and keep international competitiveness a secondary objective in the Financial Services and Markets Bill. This change would ensure that growth impacts are given equal weight, while also vitiating any potential ‘race to the bottom’. To ensure that a regulatory shift does occur, both the FCA and PRA should publish an explicit statement outlining how their secondary objectives will be incorporated and balanced.
Powers of Review
The Financial Services and Markets Bill will be helpful in another context too, in relation to the new powers of review that are to be introduced.
To be clear, the PRA has indicated that it does envision a shift in how it regulates in the coming years; the challenge will be to embed it. The PRA has already made a commitment to embed the secondary objectives, but the devil will be in the detail.168PRA. The Prudential Regulation Authority’s approach to policy. Discussion Paper, DP4/22. September 2022. Link. Again, the PRA has made some positive noises, in particular in a speech from the 27th of September. The Executive Director, Vicky Saporta noted that the PRA would seek to simplify the PRA rulebook and amalgamate a number of various requirements across a wide variety of sources.169Saporta, Victoria. The PRA’s future approach to policy. 27 September 2022. Link. The PRA’s commitment to enhancing its accountability to Parliament is also to be welcomed.170Ibid.
This welcoming noises being said, it is ultimately up to Parliament to ensure this accountability is actually embedded, and there are key ways it can do so. In particular, the Financial Services and Markets Bill, in Clause 27, requires the regulators to put forward a policy in relation to the review of the rules. Clause 27 also empowers the Treasury to require a review of the rules if they believe the regulators are not discharging their duties appropriately.
The Government has also announced that it plans to add ‘call-in’ powers to the Financial Services and Markets Bill, a proposal that has caused consternation amongst the regulators and the Bank of England.171Binham, Caroline. Government veto on City rules would be ‘serious concern’, says Bank of England deputy, 19 October 2022. This paper is agnostic about these powers, as they are likely to be used sparingly and in any case it is important that Government is ultimately responsible for regulatory regimes.
To truly embed both accountability and a nimble regulatory regime, it would be ideal if the Treasury agreed with the PRA and FCA that both institutions publish regulatory reviews at regular intervals. The Bill already specifies that the FCA and PRA must keep under review “at all times” any regulation made under the Act or any other enactment.172See Clause 27 (3RA). To ensure transparency, a regular publication schedule of reviews of whether statutory objectives are being achieved would guarantee a transparent discussion on the rules while also ensuring that such reviews are a matter of course and lessen the potential for political interference.
These reviews need not be comprehensive per se (given the review requirements already included), but they should at least encompass whether or not the regulators are meeting their statutory objectives satisfactorily, and whether their statutory objectives are fit for purpose. The Bill does require a publication of a statement of policy on review of the rules, under 27(3RB) and a statement of a regular review cycle would be appropriate. This statement of policy should envision regular review of how the statutory objectives are operating and whether they are fit for purpose. It should be noted that similar reviews or statements are already published by the FCA and PRA.173PRA. Evaluating the PRA’s Approach to its Secondary Competition Objective. March 2016. Link.,174FCA. Evaluating our work. 2 December 2020. Link.
A model that could be used here is the Bank of Canada’s regular 5-year review cycle with the Canadian Government in relation to its monetary policy framework.175Bank of Canada. Our renewed monetary policy framework. 2022. Link. The process involved research, learning from other central banks, and examining the underlying effectiveness of the regime. Obviously, the issue is somewhat different, but it does ensure that policy issues can be addressed in a timely way without creating the appearance of Government interference. In terms of the body that would carry out this review, ideally it would be regulator led, but with oversight from Government. In a previous report, Policy Exchange has also called for the National Audit Office (NAO) to be able to conduct an independent review of the regulators.176Booth, Stephen. Re-engineering Regulation: A Blueprint for Reform. Policy Exchange. 2022. Link. This should include the PRA and FCA and Government should consider means to make this happen.
While not quite the same structure, it should be noted that OSFI conducts regular audits of its policies, at a rate of roughly two a year. These include audits of its supervisory functions (2018 and 2022), and on internal governance practices.177OSFI. Internal Audit Reports. 2022. Link. APRA must report annually under the Australian Government’s Regulator Performance Framework, including on whether or not the regulator is contributing to the ”continuous improvement of regulatory frameworks.”178APRA. Regulator Performance Framework. December 2020. Link. In the United States, the Federal Reserve Board is subject to the Office of the Inspector General, which publishes regularly on various aspects of the effectiveness of the Board and the Consumer Financial Protection Bureau, including the effectiveness of their supervisory functions.179Office of the Inspector General. Audit Reports: Board of Governors of the Federal Reserve System and the Consumer Financial Protection Bureau. 2022. Link. In short, regular reviews of various aspects of supervisory policy, conducted partly at the behest of external actors are a regular occurrence in other jurisdictions, and Government and the PRA should consider a regular cycle to review the effectiveness of the PRA’s statutory objectives and their delivery.
Recommendation 6: Government should work with regulators to ensure regular review of the statutory objectives are scheduled under 27(3RB) of the Financial Services and Markets Bill. This would ensure that regulation will always be up to date and provides a minimum level of assurance that rules will be regularly reviewed in a meaningful way. It will also ensure that policy can be updated at regular intervals and new developments can be captured potentially more quickly than they would be otherwise. Government should also consider allowing the National Audit Office to independently review the work of the PRA and the FCA and whether they are meeting their statutory objectives effectively.
More Ambition Needed: Reform of the Charge Cap
Shifting regulatory attitudes and ensuring that Solvency II reform actually achieves the desired outcome must sit alongside a focus on pension reforms. While insurance regulation changes will unlock investment, it is important to keep in mind that pensions themselves are underinvesting in productive assets. Here, one of the main culprits Government has identified is the pension charge cap, another regulatory change that has had deleterious investment and attitudinal consequences.
| What is the Charge Cap? |
| The charge cap is set by Government regulation to prevent occupational pension funds in default arrangements (that is, the pensions in which auto-enrolment applies) from charging more for administration of the pension to pension holders.
The charge cap can be calculated in three ways:
The charge cap applies to all costs and charges associated with a pension scheme and the concomitant investment administration. However, it does not include the following costs:
|
The charge cap was introduced in 2015 and designed to prevent pension schemes from reducing members’ pension value through high fees. The charge cap has driven down fees, even in non-qualifying schemes. The Pension Charge Survey in 2021 shows that the number of non-qualifying schemes with charges below the cap rose from 21% to 88%.180DWP. Pension Charges Survey 2016 and 2021. October 2017 and January 2021. Link. The pension charge cap has also helped protect scheme members from exorbitant and extortionate fees – problems that beset DC pension plans recently in Australia, and which sparked a Royal Commission.181Government of Australia. Misconduct in the Banking, Superannuation and Financial Services Industry. 2017. Link.
However, the drive in cultural change is also at risk of entrenching a lack of investment in illiquid assets as these assets often have higher management costs and often invite performance fees, especially for the assets such as venture capital which offer the best return potential.182Cusworth, Emma. Price crash: is a charge cap in the best interest of savers? 23 November 2015. Link. In essence, it restricts choice in choosing who and what vehicles can manage assets, and encourages competition based on low fees. Clearly it does have some cultural impact, as fee reductions have bled into non-qualifying schemes too. Some of this cultural change is positive, but it could be going too far.
Government, therefore, launched a consultation in November 2021, entitled Enabling Investment in Productive Finance which proposed removing ‘well-designed’ performance fees from the charge cap. This was broadly welcomed by the industry. One consultee summed up the broad industry view that “performance fees are more akin to a profit share mechanism and should not be categorised in the same was as other fees.”183DWP, Enabling Investment in Productive Finance. November 2021. Link.
The Government is moving in the right direction and its recent proposals in particular to offer ‘smoothing’ of performance fees in the charge cap is welcome. A study of defined contribution pension funds found that cost was overwhelmingly the greatest barrier to investing in illiquid assets, with more than 60% of investment managers saying that this was a barrier to investing.184Groom, Nick. UK DC: A fetish for liquidity – The case for real assets. 2019. Link. The charge cap of 0.75% has to accommodate the fees of both alternative assets and public equities and bonds. Many DC pensions use index-tracking funds, which have fees of 10-15 basis points (0.1-0.15%). Natixis suggests that even if the pension used low cost index—tracking funds along with alternative assets, some illiquid assets such as private equity would still remain out of reach.185Ibid
As such, the charge cap looks, at least on paper, a barrier to higher returns even if it keeps fees down. Moreover, the proposal to exclude performance fees would specifically help ensure DC funds are able to access more forms of alternative asset, as private equity, for example, invites higher performance fees than infrastructure.
No exclusion of the fixed carried interest fees from the charge cap
This remains one of the curious exclusions from the Government’s consultation. Private equity, venture capital and other forms of growth-oriented alternative investment are some of the key areas where the Government has a compelling interest in encouraging more investment. While the performance-based aspect of the carried interest charge is included, there is a case to include the fixed element of the carried interest fee as well. This is because the carried interest model can follow the 2 and 20 fee structure – 2% of total assets, 20% of performance. This should be treated as a coherent whole for fee purposes and as such it should be excluded in its entirety from the fee cap.
To be clear, there would be no mandate that firms had to use the 2 and 20 fee structure. The 2 and 20 fee structure is not necessarily the only game in town, and pension funds such as NEST have indicated that they will engage asset managers on more appropriate fee structures.186Flood, Chris. Nest seeks lower PE fees in return for regular capital allocations. 3 April 2021. Link. Whether or not the 2 and 20 was included, there would be no mandate that such a fee structure would have to be approved. Indeed, pensions would be under the same obligations to deliver value for members, and the 2 and 20 model is in decline anyway.187Teodorczuk, Tom. Only a third of hedge fund charge 2 and 20 fees. Financial News. 9 November 2018. Link If the Government continues to be worried about the potential impact on savers in relation to the 2% fixed annual charge, it could also trial this model first on venture capital and private equity funds only, something suggested in the Government’s consultation responses.
In any case, Government should always work closely with pension funds to track different payment models, to ensure that regulators are aware of new fee structures and the latest developments in the market, and ensure that they deliver value for policyholders.
Competitive pressure to keep fees low
Excluding fixed carried interest fees from the charge cap will also not necessarily drive fees up significantly anyway, since, in the markets current form, the fees charged are usually below the cap anyway. In January of 2021, Government reported that the average charge was 0.48% and that in schemes that did not qualify for the charge cap, the average charge was 0.53%.188DWP, Review of the Default Fund Charge Cap and Standardised Cost Disclosure. 13 January 2021. Link.
Indeed, one of the pernicious effects of the charge cap is that some in the industry have found that by introducing the cap in 2015, Government gave a clear signal to the DC market that reducing fees should be a major focus on competition in the industry. This resulted in schemes competing less on value than on the ability to charge lower fees. As one consultation respondent put it
This has reduced the range of investment opportunities and means many investment strategies are now immediately dismissed as DC pension candidates, either because they are actively managed or are perceived to be more expensive than the passive options currently available. This focus on cost is therefore limiting innovation in longer term investment strategy.189Ibid.
While the Government’s current initiatives to exclude more kinds of fees from the cap is admirable, there is a case to argue that the charge cap in any case sends the wrong signal to the industry. Instead, if Government wants to drive cultural change in the DC market, it is better off pursuing more aggressive consolidation in the sector. This is the subject of the next chapter, which examines specifically how more consistent consolidation in pensions in Australia has driven increased investment in illiquid assets and empowered Australian schemes to seek higher returns over time.
Recommendation 7: Government should proceed with excluding performance fees from the charge cap. It should expand this exclusion to include the fixed element of carried interest fees. Government should also work with the asset management industry to explore other fee performance models. This would ensure that the charge cap does not prevent DC pension schemes from investing in certain classes of illiquid and alternative assets altogether, especially venture capital and private equity. Government should ensure that a variety of different forms of alternative asset are legitimate choices for pension schemes, unhindered by different performance fee structures, other than competitive pressure.
Next chapterChapter 4: Better Pension Markets
Introduction
Alongside changes to the charge cap, there also needs to be a better exploration of how the structure of the pension industry in the UK encourages alternative investment. Currently, the fragmentation in the UK pension industry discourages illiquid investment, and Government should to do more to shape the market further to achieve more productive investment. If the UK invested like its international peers in alternative assets, and 10% of this amount was invested in the UK, it would mean an additional £40.6 billion for British businesses and infrastructure.190Author’s calculations based on a 12% increase in the allocation to other assets, based on the Global Pension Asset Study 2022.
This chapter is divided into two parts: the first looks at how the DC market can be better shaped by Government and how Government can encourage consolidation. The second part examines the Local Government Pension Scheme, and how the UK Government, unlike funds in Canada and the Netherlands, does not administer large funded pensions to encourage investment in illiquid assets. Defined Benefit pensions in the private sector are not the focus of this chapter, as many DB schemes are currently de-risking and not accepting new members.
The Defined Contribution Pension Market in the UK
DC pensions schemes in the UK invest much less than their international peers in alternative assets and tend to be smaller. These two facts are related: in other jurisdictions smaller schemes tend to invest less in alternative assets since they cannot benefit from economies of scale and are more constrained in terms of risk and liquidity. It is worth noting that, though daily pricing is often seen as required for DC pension schemes, there are no regulatory or legal requirements to actually do so.191APPG for Alternative Investment Management. UK Pension Schemes and Alternative Investments. February 2019. Link. Structural and cultural reasons are key factors. The Government has tried to address these to a certain extent via the Long-Term Asset Fund, for investment in mostly illiquid assets.192FCA. Broadening retail access to the long-term asset fund. 1 August 2022. Link.
Government has stated that it has wished to see the consolidation of the defined contribution pension market.193DWP. Future of the Defined Contribution Pension Market: The Case for Greater Consolidation. 30 March 2022. However, it has indicated in a recent consultation response that it has no plans to push consolidation further. This is a mistake because pension market consolidation is key to accessing alternative assets. Instead, the UK should look to its close comparator Australia as a model of consolidation, and how defined contribution pensions can invest heavily in alternative assets at home and abroad.
The Structure of the UK Pension Market
The defined contribution pension system in the United Kingdom is relatively new; auto-enrolment was only introduced in 2012.
Figure 25: DC Pension Members, by size of scheme
The Pensions Regulator
Figure 26: DC Pension Total Assets, by size of scheme
The Pensions Regulator
In the past decade, total pension assets have increased 413%194TPR, DC Trust: scheme return data 2021-2022. 2022. Link., and membership has increased by 938%.195Ibid. The market has in fact consolidated to a large degree already, and the number of schemes with more than 12 members has fallen by 62% in the last 10 years, from 3,680 schemes to 1360.196Ibid.
However, there are two problems in the current UK market. Firstly, there remain 21,970 micro pension plans, of which the vast majority are relevant small schemes.197Ibid.
Australian Superannuation
The Australian superannuation market is one of the largest in the world. According to the latest estimates, Australian superannuation assets as of March 2022 are AUS$ 3.44 trillion (£1.99 trillion).198APRA, APRA Released Superannuation statistics for March 2022. 24 May 2022. Link
Yet, these substantial sums are not indicative of a market with a large number of providers. In fact, in Australia, the number of super funds has fallen from 1511 in 2004 to 162 in March 2022 – a fall of 89.3%. The chart below shows the extent of the drop, and how consolidation has been a consistent process over the last few decades.
The consolidation in the pension market has coincided with a sharp increase in assets over the same time period.
Figure 27: Australian Superannuation Funds, Schemes with more than 4 members
Source: APRA199Years 2004 to 2019 taken from APRA, A Timeline of Superannuation. Link. Years 2020 to 2022 taken from Sep quarterly statistics, or, for 2022, from the March 2022 Quarterly superannuation performance statistics bulletin. Link.
Figure 28: Australian Superannuation Assets in Entities of More than 4 Members ($AUS)
APRA Quarterly Statistics
Assets have increased from nearly AUS$500 billion to AUS$2.5 trillion, a total increase of 383%.200APRA, March 2022 Quarterly superannuation performance statistics bulletin. 24 May 2022. Link. The superannuation market in Australia is overwhelmingly defined contribution, with a split of 83-17%.201Thinking Ahead Institute, Global Pensions Asset Study 2022. 2022. Link.
This is a significantly larger proportion than any of the six other countries included in the analysis, shown in the chart below. These countries, with Australia, make up the seven largest pension markets in the world by size of assets.
Figure 29: DB/DC Split
Thinking Ahead Institute202Switzerland uses a slightly different pension structure that does not map well onto the DC/DB Split. See Global Pension Asset Study 2022 for more details.
Value for Money
Securing value for money in Australian superannuation remains a key priority, and this is accomplished through consolidation. In a recent survey of fund executives, consolidation was itself driven by the desire for scale which could allow funds to compete more effectively and pass on member savings. The benefits of consolidation are such that nearly 70% of those surveyed expected there to be 100 or fewer superannuation funds by 2025.203JP Morgan. The Future of Superannuation: A Shared Perspective. 2021. Link. Executives stress that consolidation could deliver concrete fee reductions. One noted that they were able to deliver a 20% reduction in fees for new members.204Ibid.
Consolidation has also brought with it an attempt to in-source investment. 62% of those surveyed suggested that insourcing investment would drive down costs – it also allowed funds to spread out the fixed costs of investment – rather than incur the usual percentage fee from external managers.205Ibid. One saved AUS$200 million in one year by moving to internal teams for a greater number of assets.206Ibid.
The Australian Productivity Commission noted in its review of the superannuation system in 2018 that, at that time, if the 50 highest-cost funds merged with the 10 lowest-cost funds, the average member would benefit by $22,000 at retirement, or AUS$1.8 billion annually.207Productivity Commission. Superannuation: Assessing Efficiency and Competitiveness. No. 91, 21 December 2018. Link. One of the key reasons this consolidation had not yet happened was because of a lack of competition in the market.208Ibid.
Investing in Alternative Assets
Australian superannuation schemes are also strong in investing in illiquid assets, both in comparison to the UK, and indeed to the global pensions market more generally.
According to one study of the superannuation industry, nearly 70% of Australian superannuation funds allocate more than 5% of their total asset portfolio to infrastructure, more than three times the proportion of global pension funds who said the same.209Preqin, Australian Superannuation Funds in Alternatives. November 2018. Link.
Figure 30: Proportion of Funds Reporting More than 5% Allocated to Alternative Assets
Preqin
While in private equity superannuation funds tended to underinvest compared to international peers, this is changing. Part of the reason for this is that the VC sector in Australia is generally much less mature210Ibid - venture capital investments as a proportion of GDP is much lower in Australia than the UK, Canada or the US, its closest comparator markets211OECD, Venture capital investments as a percentage of GDP. Link. - and partly because the recession in 2008 generated poor returns for superannuation funds in PE classes and as a result have a poor reputation; as one investor put it “PE has had a 10-year bull run, and they tend to get more valuation problems in PE than in real assets. We would be very cautious for anyone going into PE now”.212Preqin, 2018.
The other factor is that Australian superannuation funds are encouraged to invest in domestic liquid equities because of beneficial tax arrangements.213Ibid. This is not just a problem for private equity and alternatives more generally, concerns have been raised that the industry is domestically overweight”.214Ibid. This is regarded as a problem that needs to be addressed.
Consolidation has also encouraged further investment in alternative assets and in private equity. Since December 2018, private equity investments have increased by AUS$42 billion, and one report by the Boston Consulting Group projected that superannuation funds would move more than AUS$185 billion into PE by 2025.215Booth, Meredith, Super Funds expected to move above $185 billion in private equity investments by 2025. Investment Magazine. May 23 2022. Link.
According to the Financial Times, superannuation funds are about to on an “international shopping spree”, and will embrace direct investing, because consolidation has meant that funds are now at the scale to invest directly.216Wigglesworth, Robin and Josephine Cumbo. Financial Times. 23 June 2021. Link. As one commentator put it “superfunds are becoming more complex as they move from being an accumulator of assets to looking more like asset managers”.217Gout, John and Pember, Dave. From DB to DC and beyond: Lessons for pension funds and servicers from Europe and Australia. BNP Paribas. 31 August 2021. Link.
To be clear, even before these consolidations take effect and Australian supers increase their investments, Australian superannuation funds are still investing more in alternative assets than their UK counterparts. Comparing the latest statistics in private DC pension funds in Australia and the UK shows that private DC schemes invest at most 12.84% of their portfolio in alternatives218Corporate Adviser. Master Trusts and GPP Defaults Report. April 2022. Link., compared to 22.9% in alternatives in Australian super funds.219
A former Australian pensions minister, Nick Sherry, has noted that consolidation has made it far easier in the Australian context to invest in infrastructure. Furthermore, Australian superfunds can provide daily pricing while doing so.220Leandro, Paul. Is consolidation a silver bullet for UK pension challenges?. Barnett Waddingham. March 23 2022.
How Australia Consolidated
The benefits of consolidation did not, however, get driven solely by market forces. The Australian Government has consistently intervened in the market and simultaneously expanded superannuation and ensured that it worked for those with superannuation accounts.
| Timeline of Superannuation Policy in Australia221Taken from Superannuation in Australia: a timeline. Link; and from Parliament of Australia, Chronology of superannuation and retirement income in Australia. 2010. Link | |
| 1980s | Superannuation is first introduced, is not transferable between employers and limited to public servants. |
| 1987 | Just 32% of private sector employees were covered. From the introduction of the National Wage Case guidelines 1986, contributions start to be added to industrial awards.222Australian term for union agreements. Private sector employee coverage increases to 68% by 1991. |
| 1992 | Government introduces the Superannuation Guarantee, with a mandatory 3% contribution rate (or 4% for larger employers). Mandatory rate increases to 9% in 2002 and 9.5% in 2014. |
| 1993 | The World Bank considers the Australian pension system, based on compulsory superannuation, the age pension and voluntary savings, as ‘world best practice’. |
| 1996 | Total superannuation assets estimated at AUS$245.3 billion. |
| 1999 | As a result of the Wallis Inquiry – a landmark investigation of the Australian financial system – Self-Managed Super Funds (SMSFs) are established to allow small businesses and self-employed people to create their own accounts.
The Wallis Inquiry also advocated choice more broadly for those in superannuation funds. SMSFs are regulated by the Australian Tax Office (ATO), not APRA. |
| 2001 | The Financial Services Reform Act created a single licensing and disclosure regime for all financial services, including superannuation. It started March 2002. |
| 2004 | Superannuation regulations were changed to allow portability between superannuation accounts. |
| 2006 | Transferring superannuation accounts between funds is made easier, along with tax changes to encourage investment in superannuation. |
| 2007-2009 | While superannuation assets reached above AUS$1 trillion for the first time in 2007, the financial crisis wiped out $200 billion, returning to pre-recession levels by 2010. In the same period, superannuation became more portable between spouses, including same-sex partners. |
| 2011-2014 | Government introduces the Stronger Super reforms. The most important reform was the creation of MySuper, which ensured that superannuation funds created easily comparable default funds. By 2014, workers who did not nominate a fund would have contributions put into a MySuper fund chosen by their employer.
APRA, the financial regulator created in the aftermath of the Wallis Inquiry, is given a framework to address fund governance and risk management. |
| 2015-2019 | Consolidation in the industry continues. The number of superannuation funds decreases from 255 in 2015 to 207 in 2019. |
Recent Changes
The Australian Government has moved even further towards giving consumers choice, partly as a result of a major Productivity Commission Report in 2018. The report recommended strengthened Government tests for default products, a stronger relationship between consumers and their pensions, and stronger Value for Money tests for default pension products, among others.223Productivity Commission. Superannuation: Assessing Efficiency and Competitiveness. Productivity Commission Inquiry Report. No. 91, 21 December 2018. Together, these measures ensure that individuals avoid multiple superannuation accounts and the attendant fees that accompany those sorts of products.
It is important to highlight too that Australian regulators do not see choice as inherently tied to a specific number of funds. As a matter of fact, APRA has stated that “even 185 funds…is still a large number and means the industry is probably not operating at maximum efficiency.”224APRA. Myths and misconceptions should be no barrier to super consolidation. 2022. Link. If 185 funds is still too many, 1360 UK schemes probably is too.
The Coalition225A centre-right government in the Australian context Government responded in part to these reports by introducing the Your Future, Your Super reforms in the 2021 Budget. The measures introduced included
- A new super fund underperformance assessment made public for consumers
- A superannuation fund comparison tools to compare default funds
- A requirement that employers have to check with the Australian Tax Office (ATO) to see if the employee has an existing super fund, known as the “stapled super fund”, which the employer must pay the guarantee into
- New duties for trustees to act in the best financial interests of members226ATO, Super Reforms – Your Future, Your Super. 27 August 2021. Link.
The point here is that Government has consistently intervened in a pro-competition, pro-consumer way to ensure better results for members, and to shape the industry to keep fees low and returns high. Australia is a high-income country – significantly higher than the United Kingdom – with a free market.227Heritage Foundation, 2022 Index of Economic Freedom. 2022. Link. If Australia can be robust in ensuring both consumer protection and the ability to invest in alternative assets like infrastructure, the UK can too.
Current Plans in the United Kingdom
The UK Government has not necessarily exhibited the same degree of long-term commitment in managing the shape of the UK pension industry; this should change. In the Government’s response to the DWP Consultation Future of the defined contribution pension market: the case for greater consolidation, it noted that “the consensus was for Government to slow down the process to ensure better member outcomes are being achieved”.228Part of DWP, Consultation outcome: Facilitating investment in Illiquid assets. 22 July 2022. Link. This is unfortunate, as the Government has in the past taken steps to proceed with consolidation. It should maintain this ambition.
Indeed, measures the Government has introduced, such as the value for member test of schemes under £100m, are themselves industry driven. Trustees themselves do the value for member review. To quote one respondent, “no matter how objective the assessor tries to be, there is likely to be an unconscious bias in favour of a positive assessment of the scheme’s governance.”229Ibid. Notably, the value for money test does not come with a legal obligation to wind down the scheme.230Ibid. To further quote a respondent, in this case the Society of Pensions Professionals, “our expectation is that most trustees of schemes that do not pass the value for member assessment will initially look to improve before winding up.”231Ibid.
Australian evidence suggests consolidation can bring genuine savings for pensioner holders. Funds of around $AUS 20 billion generally have the lowest fees.232Sherry, Nick. What the UK pensions industry can learn from Australia. 21 July 2022. Larger funds can attract economies of scale.
As the Australian example shows, consolidation can also be pro-consumer, and encourage better returns and better investment as a result of economies of scale. Government regulation can encourage a more competitive and transparent environment. It would also ensure members avoid excessive fees thanks to multiple accounts.
For example, one way consolidation could be encouraged immediately by Government would be to reduce the regulatory and administrative burdens associated with change. To quote another respondent to the consultation:
“In our experience of working with own trust clients, two of the main barriers to clients consolidating are time and the potential transaction costs. The work involved in communicating to members, managing project work streams, selecting providers is significant and this is assuming that the administration records are of sufficient quality to be able to transfer.”233Ibid.
In the United Kingdom, it is employers, not employees, who get to choose the pension scheme, and portability is significantly less emphasised than it is in Australia. There is little data on the proportion of members who have multiple pension schemes with multiple previous employers. As a result, there is less pressure from members to ensure higher returns built into the system. Similarly, there is little published evidence in terms of returns for each pension scheme. This sort of transparency would encourage consolidation too.
Master Trusts
One argument sometimes presented in favour of the current model in the United Kingdom is the existence of Master Trusts, which are large, multi-employer trusts which have the scale sometimes seen in the Australian market. There are currently 36 Master Trusts, which control £78 billion in assets.234TPR, DC Trust: Scheme Return Data 2021 to 2022. 2022. Link. This is the majority of the private sector DC assets in the UK, and so it could be argued that consolidation has already proceeded well. Indeed, further consolidation in Master Trusts would only weaken competitive impulses as there are already so few master trusts.
This is a fair point, insofar as Master Trusts are already highly consolidated. However, they also show the limitations of the current model of pensions in the UK. Master trusts cannot be chosen by members and are ultimately invested in by schemes themselves. As such, these entities that can deliver better returns at scale sit at one remove from the members themselves and have a weaker regulatory and competitive framework.
Furthermore, Master Trusts do not yet have the size or the experience to invest in alternative assets at scale yet. In their latest quarterly accounts, Nest, the UK’s largest master trust, allocated only 0.5% of its portfolio to private equity, and just 4.2% in infrastructure, aiming to 5% by the end of the decade.235Nest. Nest quarterly investment report: At end June 2022. 2022. Link.,236Dohle, Mona. Defined Contribution: A brave new world. 28 February 2022. Link. Data included on Corporate Advisers, which follows Master Trusts closely, shows only a third of Master Trusts allocate funds to alternative assets in their 30-year to retirement plans.237See Annex 1 for full data.
Across private sector defined contribution assets generally, pooled investment vehicles invest primarily in equity, and mixed asset funds. Mixed asset funds are typically a mix of bonds, equities and cash, and so are not typically evidence of alternative investment.238Blackrock. Multi-asset funds. 2022. Link. Furthermore, the ‘other’ category about 12% of investments, includes cash, commodities, structured products and other profits.239ONS. Funded occupational schemes in the UK: July 2019 to March 2022. 22 September 2022. Link. Taking both DC and DB private sector pensions together, the latest ONS figures suggest no more than 11.2% of all direct investments (which make up less than half of all assets) are invested in property, alternatives and other assets.240Ibid.
Figure 31: Private Sector Defined Contribution Asset Allocation, Pooled Investment Vehicles
ONS
By comparison, the 158 Australia superannuation funds with more than four members manage, between them, AUS$2,393 (£1.3 trillion).241Asfa. Superannuation Statistics August 2022. 2022. Link. On average, Australian superannuation funds with more than seven members invest 8% of their portfolios in infrastructure, 5% in unlisted equity and 8% in property,242Ibid. showing the extent to which even Master Trusts are underperforming.
Through a consolidation process, Government should aim to bring members closer to the Master Trusts, and ensure that Members themselves can have more say in how the Master Trusts are investing and what returns are being secured. Far from being an argument for halting a consolidation process, Master Trusts show why the UK’s pension markets still need reform.
Where the Financial Services and Markets Bill Can Help
The Financial Services and Markets Bill does not deal directly with consolidation in the pension market. However, the FCA is a significant regulator of pensions in the UK, and here the FSM could encourage the regulator via the ‘have regard’ clauses in a new section 138EA.
This would allow the Treasury to create regulations to require the FCA and the PRA to have regard to certain matters when making regulatory decisions. This can in turn encourage the regulator to examine questions in certain ways and to shift the regulatory trajectory in specific directions. Using this section, the Treasury could require the FCA to have regard to pension consolidation and member value in how it carries out its regulatory functions. This would further help encourage consolidation in the market and ensure a specific long-term policy goal.
Recommendation 8: Government should launch a consultation into identifying and reducing particular administrative burdens which hinder consolidation, and in particular examine ways to expand the Value for Members test to schemes over £100 million, and to strengthen government powers in relation to winding down failing schemes below £100 million. Pension consolidation is one way to increase pension investment in alternative assets, and secure better returns for members.
Pension consolidation in Australia has been used to improve outcomes for consumers and to maintain high standards of investment. The UK should look to its example when designing its own pension system, and in particular aim to replicate the same consumer. This can be done by reducing the regulatory burden of consolidation, establishing performance benchmarks via the incoming pension dashboards, and improving member choice in pension schemes.
Recommendation 9: Government should use new ‘have regard’ powers in the FSM Bill to encourage consolidation. Consolidation should be entrenched as a key aim of pension regulators going forward. The FSM Bill would give Government additional means to embed these aims within regulatory priorities.
Better Public Sector Pensions
Alongside the need to improve the private pensions market in the UK, the Government should also consider the state of public sector pensions, and in particular pensions offered to Government employees.
This report has examined the Australian market in relation to consolidation in private pensions. The Government should also consider how strong, public sector pensions for public employees can be used to mobilise capital as well. The UK currently has a mixed model of public sector pension provision. For example, the Local Government Pension Scheme is a funded scheme, while the majority of national public service employees contribute to unfunded pension schemes – with contributions worth £47.2 billion in 2022-2023 alone.243OBR, Public service pension payments (net). 27 April 2022. Link.
As with private pensions, the UK could do more by better shaping public pensions. Here, the UK should look to the Canadian example, where large public sector pensions deliver world-beating returns and are some of the most innovative investors when it comes to alternative assets of all kinds. The UK could learn from the governance and funding arrangements that make the ‘Canadian mafia’ of public sector schemes some of the best in the world.
Improving the Local Government Pension Scheme
The Local Government Pension Scheme is one of the largest pension schemes in the world. It is a huge pool of assets which could be invested in some of the highest return, most productive asset classes. It is a Defined Benefit pension scheme, and currently has £341.3 billion in assets, as of 31 March 2021.
This scale of assets should, one would think, result in alternative investments. Unfortunately, compared to the gold standard of public sector pension investment– Canada’s large, public sector defined benefit funds, the UK’s LGPS is a drastic underperformer.
Figure 32: LGPS Pools – Asset Allocation244England pools only.
Figure 33: Asset Allocation - Large Canadian Public Sector Pension Funds
Numbers may not add up to 100 due to rounding.245Acronyms are as follows, the PSPIB is the Public Sector Pension Investment Board; OPTrust is the OPSEU Pension Trust; OPB is the Ontario Pension Board. OTPP is the Ontario Teachers Pension Plan. OMERS is the Ontario Municipal Employees Retirement System; HOOPP is the Healthcare of Ontario Pension Plan; CPPIB is the Canada Pension Plan Investment Board; CDPQ is the Caisse de depot et placement du Québec; BCI is the British Columbia Investment Management Corporation; AIMCo is the Alberta Investment Management Corporation.
As shown in the above tables, the LGPS is a remarkable underperformer in terms of investing in productive assets. While on average the selected LGPS pools (ACCESS did not have available data) invest nearly 73% of their assets in listed equities and bonds, this compares 36.4% of assets allocated in the selected Canadian pension funds. More remarkably, Canadian pension funds are in a different league when it comes to infrastructure and private equity specifically. The Canada Pension Plan Investment Board (CPPIB), which holds a similar level of assets to the LGPS invests more than four times as much in private equity as the most private equity exposed LGPS pool – the LGPS LPPI. In terms of infrastructure, the Ontario Municipal Employees Retirement Scheme (OMERS) invests twice as much in infrastructure as the most exposed pool, LGPS Border to Coast.
Across every metric, Canadian DB public pension schemes are better at investing in productive assets.
Solvency and Performance of Canadian Schemes compared to the LGPS
This has not resulted in weaker results for Canadian pensions: quite the opposite. The median solvency ratio for Canadian DB schemes is now 109%, in the midst of one of the worst economic crises of the last half-century.246Mercer. DB Pension Plans’ financial positions improve despite recession fears and record inflation levels. July 4 2022. Link.
OMERS and OPTRUST, the schemes most like the LGPS in terms of who takes part (municipal employees), are 97% and 100.7% funded respectively.247OMERS, Annual Report Highlights. 2021. Link.
The OPTrust has been fully funded for 13 consecutive years.248OPTrust, Moving Forward – OPTrust’s 2021 Funded Status Report. 2022. Link.
In terms of investment performance, Canada also performs exceptionally well. One estimate showed that between 2007 and 2017, Canadian funds generated an additional $4.2 billion (£2.7 billion) per year for a decade.249World Bank Group, The Evolution of the Canadian Pension Model. 2017. Link.
Furthermore, the investment into real assets is a very good hedge against inflation risk, and Canadian public funds invest twice as much in real assets than the rest of the world.250Beath et al. The Canadian Pension Fund Model: A Quantitative Portrait. July 2020. Link.
Indeed, even the funds that invest comparatively less in alternative assets, such as AIMCo and the BIC are the exceptions that prove the rule. In both cases, the BCI and AIMCo represent a multitude of smaller funds and thus each particular client fund or endowment may have a smaller appetite for risk given the scale of the underlying assets. However, even in those two cases, these funds managed to invest more in alternative assets than the LGPS. HOOPP, probably Canada’s most ‘conservative’ large pension fund in terms of investment strategy, also managed to invest more in alternative assets than the LGPS and its pools in every category save infrastructure.
Indeed, if the LGPS invested its assets in each category to the average of the 10 largest Canadian pension funds, this would result in £35 billion invested in infrastructure, £52 billion invested in private equity, £30 billion invested in credit, £45 billion invested in property, and £12 billion invested in other assets of various kinds. Assuming a 15% asset allocation to the UK, this would instantly boost the UK economy by £26 billion.
And the scale of investment return weakness is stark too. In 2020, when various funds had difficult periods, Canadian funds managed excellent returns. OMERS did not have a strong year, and this was considered very poor indeed by its stakeholders.251CUPE, Not Just One Tough Year: The Need for a Review of OMERS Investment Performance. May 2021. Link.
Yet OMERS still performed better than LGPS that year, which performed far worse than a variety of Canadian funds.
Figure 34: Annual Investment Return, 2020
Making Structural Change
Contrary to what might be assumed, Canadian funds did not achieve this level of investment in alternative assets through political pressure. Canadian funds are structured in ways that facilitate long-term investment strategies and excellent returns through independence and unified corporate structures.
The CPPIB for example is a Crown Corporation252Effectively equivalent to an Arms Length Body which reports to an independent Board of Directors, and is governed under the CPPIB. The Finance Ministers of the Federal Government and the provinces are the ultimate stewards, although they play little or no part in directing the CPPIB in any way.
OMERS is governed by two boards of directors, an Administration Board and Sponsor Board. The latter invests funds and communicates with members. The former involves all relevant stakeholders and sets contributions and pension benefits over the long-term. Both were created in 1962 via provincial statute in Ontario.
Talent is recognised. One report on the Canadian Pension Model noted that Canadian funds actively recruit global talent and compensate accordingly. Boards are recruited from investors and businesspeople in Canada and abroad, and global searches are undertaken for top pension management.253World Bank Group. The Evolution of the Canadian Pension Model. 2018. Link. Armed with this top talent, Canadian pension funds manage investments in house, which ensures lower fees for managing alternative assets. BCI, for example, manages 80% of its investments internally.254BCI, 2021-2022 Corporate Annual Report. 2022. Link. This results in a situation where compensation is higher than other countries, but overall investment costs are lower because much less is being contracted outside the fund.255World Bank Group, 2018. Indeed, in many cases it was in-house talent which encouraged investments into alternative assets and strategies.256Ibid.
In the LGPS, by contrast, there is a fragmented investment structure which is not conducive to either the best returns or to investment accountability. The LGPS is currently governed by 86 pension boards257 A previous version indicated 88 boards and schemes, which reflected the 2019 triennial evaluation. There are now 86 open schemes, and 1 EA closed scheme. and pension committees across the UK, with some pooling via the eight LGPS Pools. There is no obligation to join the pools, and local pension funds also choose to invest their assets differently. The pension boards are run by local councillors and representatives of local council employees.
The Dutch Approach
A more centralised model is not just confined to Canada. Dutch pension funds also offer a potential governance model that contributes to more alternative asset allocation than the LGPS. Moreover, the Dutch model shows that centralised pension funds need not be state-run, as they are in Canada. Furthermore, the Netherlands is overall a strong pension comparator, as it is a member of the P7 and has the highest pension to GDP ratio in the world, at 213.3%.258Thinking Ahead Institute. Global Pensions Assets Study 2022. 2022. Link.
The pensions in question are not all state run but have been created between agreements between employers and employers. For example, the construction industry pension, the “Foundation for the Construction Industry Pension Fund” (bpfBOUW) is managed by trade unions and employer organisations.
Like the LGPS, they are large pools of assets, although most are smaller – only the Dutch social security fund ABP is larger. However, because of the centralised management structure – like the Canadian pension funds, large Dutch funds are able to invest in alternative assets to a high degree. The five largest Dutch schemes (state and non-state), have private equity investments ranging from 4.6% to 35.7%, and property/infrastructure investments (some funds make no distinction) ranging between 5.3% and 17.2%. Four of these funds are smaller in asset size than the LGPS, yet all manage to invest significantly more in alternative assets. This has resulted in strong annualised returns; Dutch pensions grew twice as much between 2011 and 2021 as UK pensions.259Thinking Ahead Institute. Global Pension Assets Study. 2022. Link.
Figure 35: Asset Allocation – Big 5 Dutch Pension Funds
Both the Canadian and Dutch experiences show that centralised, professionalised investment strategies can drive performance within large pension schemes. The LGPS should be no different, and Government should look actively at reforms to improve governance and structure in this key asset pool. This will help spur vital investment in alternative assets.
Recommendation 10: Government should look to consolidate the current Local Government Pension Scheme investment pools further and phase out the 88 pension boards. Instead, Government should consult on a new pension model that examines closely the Canadian public sector defined benefit model. Government should aim for a pension structure that encourages long-term investing with minimal political interference. The pensions board should be managed by leading investment professionals and Government should undertake an international talent search.
Managing Civil Service Pensions and Boosting Investment
In one sense though, the LGPS is the least of Government’s worries when it comes to public sector worker pensions. The public sector pension liability in the UK is now £2.2 trillion, or nearly 100% of UK GDP.260Janiaud, Alex. Public sector pension liabilities break £2tn with 16% surge. Pensions Expert. Link.
Civil service pensions in the UK are unfunded, meaning they are paid through current contributions and topped up by the Treasury if there is a shortfall. The Treasury undertook a number of reforms in the 2010s to alleviate the potential fiscal burdens, but these were found to be in part unlawful, and a £17 billion shortfall was created. The Public Accounts Committee noted that the Treasury has not yet performed an evaluation of these reforms.261Public Accounts Committee, Public Sector Pensions. 11 June 2011. Link.
The Opportunity
By maintaining a largely unfunded model, the Government is missing out in two key respects. Firstly, it is continuing a long-term fiscal liability, and secondly it is foregoing a significant pot of capital it could invest in the UK economy.
Here, the UK should look to the Public Sector Pension Investment Board (PSPIB) the public sector pension established by Canada in 1999 to deal precisely with the question of pension affordability. Its members include the civil service of Canada262Known technically as the ’Federal Public Service’, the Royal Canadian Mounted Police, the Armed Forces and the Reserves. The 10-year return as of the latest annual report is 9.8%.263PSP, Investing for a Better Tomorrow. 2022. Link. Currently, the cost of the scheme is split 50:50 with the Federal Government.264Government of Canada, What is the public service pension plan. 2022. Link. It remains a defined benefit pension, and the Public Service Plan is 111% funded.265CUPE, May 2021. This is in contrast to the UK public sector pension, which continues to require significant payments from taxpayers to remain solvent – more than £20 billion over the next four years.266OBR. Public service pension payments (net). As of March 2022. Link.
The PSPIB also invests heavily in private equity, infrastructure and other alternative assets at home and abroad. The fund has £150 billion in net assets267PSP, 2022. and 48.5% are allocated to alternative asset classes. The PSPIB is set up as a crown corporation, and its board is comprised of leading figures from the international and Canadian financial and investment worlds. The evidence for the impact of funded pensions on the overall economy is also positive. Economic growth is enhanced through funded pensions,268Philip, Davis and Hu, Yu-Wei. Does funding of pensions stimulate economic growth?. 15 April 2008. Link. they help deepen capital markets,269Thomas, Ashok and Spataro, Luca. The Effects of Pension Funds on Market Performance: A Review. 22 August 2014. Link. and can stimulate growth in the manufacturing sector, particularly those firms who rely on external finance.270Bijlsma et al. Funded Pensions and Economic Growth. 2018. Link.
Canada’s pension funds also have the capacity to foster innovative approaches to public-private partnership. Most notably, the Caisse de depot et placement du Québec (CDPQ) has created its own subsidiary, CDPQ Infra that is simultaneously the operator and partner investor in key infrastructure projects. The CPDQ thus can up-front capital and be a “one-stop shop” for project delivery.271McKinsey. Remodelling infrastructure financing: A Q&A with CDPQ Infra’s Macky Tall. 15 September 2020. Link. More importantly, the CDPQ merges private sector operation while meeting a key social mission: in this case to make Quebecer pensioner’s savings grow. This mission means that the CDPQ can combined an investment, return-oriented mindset with meeting key infrastructure needs. It also creates one remove from the Government on infrastructure management and planning – thereby decreasing political risk – while also helping delivery long-term government priorities.272CDPQ Infra. CDPQ Infra: A better understanding of the model. 22 March 2022. Link.
Another example of a similar initiative is the Australian IFM – which was created in 1990 as a way for Australian super funds to invest in infrastructure assets at home and abroad. Funds under management currently stand at AUS$172.2 billion, servicing the retirements of 30 million people, and IFM now helps pension funds and other institutional investors facilitate illiquid investments.273IFM Investors. Responsible Business Report. 2021. Link. The UK Government had tried something similar in the past – the Pensions Infrastructure Platform, which was sold to the Foresight Group in 2020.274Global Infrastructure Hub. Facilitate long-term investment by tapping into captive funds. 1 November 2021. Link. This effort was hampered in part by scepticism in the industry,275Brenton, Hannah. Experts doubt Pension Infrastructure Platform. Professional Pensions. 29 August 2012. Link. and ultimately raised only a fraction of what was projected.276Global Infrastructure Hub. 2021 Government should look into why this effort was less successful.
In the future a UK public sector funded pension body could potentially create a similar structure in the UK. It could also help co-ordinate more effectively with the myriad of organisations currently operating in the investment and infrastructure spaces across the UK, like the UK Infrastructure Bank (UKIB), the Business Growth Fund (BGF), the Green Investment Bank and Homes England.
Exploring the Case for Funded Pensions in the UK
The UK public service currently makes significant contributions to its pensions every year. According to the latest data, between 2021-2022 and 2025-2026, the UK public sector pensions will accrue £241.4 billion in receipts, the vast majority from employer (Government) contributions. Since the employer in these cases are taxpayers, this is taxpayer money which is going directly to pay the pensions of public employees.
Even if the United Kingdom set up a partial fund for its pensions, perhaps 25% of receipts, this would a £60 billion pound investment pot in five years that could be allocated to alternative and other asset classes. Moreover, if the fund achieved a 5-year annualised net return similar to the PSPIB – 9.8% – in five years that £60 billion would generate an additional £32 billion which could be reinvested.
If the Government was going to embark on this reform, it should also want to consider the various separate schemes that currently exist. Currently, the Government administers
- Principal Civil Service Pension Scheme
- NHS Pension Scheme
- Teacher’s Pension Scheme
- Armed Forces Pension Scheme
- NHS and Teacher’s Pension Schemes, Scotland
- Northern Ireland Executive Pension Scheme
- LG Police Force Pension Scheme
- LG Firefighter’s Pension Scheme
Each of these schemes has different rules. For example, the NHS scheme requires contributions of 5.0% of earnings in the first £15,431.99, whereas the civil pension scheme involves member contribution rates of 4.60% in the first £23,100. One of the recommendations of the Hutton Review into Pensions in 2011 was to move public service pensions “towards a common framework”.277Independent Public Service Pensions Commission. Final Report. 10 March 2011. Link. The diversity of the current schemes could be accommodated while also ensuring a common baseline by creating a high-quality professionalised investment/pension fund in the United Kingdom for a greater number of the UK’s public sector pensions.
A multi-fund manager like Alberta’s AIMCo or the British Columbia Investment Management Corporation (BCI) would be ideal. While these funds still operate in a consolidated way, like all Canadian pension funds, both these providers operate a variety of different schemes. They also manage to invest heavily in alternative assets. BCI invests more than 14% of its assets in private equity and infrastructure, and AIMCo invests more than 21% in these assets.
The UK could create a similar model, something like a ‘UK Pension Management Corporation (UKPMC)’, which could invest contributions and put public sector pensions on a sounder footing and encourage economic growth.
Of course, such a course of action is also expensive, since current pensions (which are unfunded) have to be paid out, while current pension contributions are paid out. In order to create the reserve fund for the CPPIB, for example, the Canadian Government doubled pension contributions in 1999, where they have stayed ever since.278Ambachtscheer, Keith. Canada Pension Plan. 19 November 2021. Canadian Encyclopedia. November 19 2021. Link. Current workers are required to pay not only for the fund for their current pension, but for retirees as well.279World Bank. Transition: Paying for a shift from pay-as-you-go financing to funded pensions. 2005. Link. Evidence suggests there also no pareto-improving transition, meaning that any change will involve some form of intergeneration redistribution.280Brunner, Johann K. Transition from a pay-as-you-go to a fully-funded pensions system: the case of differing individuals and intergenerational fairness. 1993. Link.
In any case, while there are significant merits for the British economy and finances to move to a funded pension model, there are also significant technical and political challenges in doing so. As such, Government should issue a call for evidence on moving to funded public service pensions, and consider in particular both funding arrangements and ways such a fund could encourage alternative investment.
Recommendation 11: Government should issue a call for evidence on shifting to public sector funded pensions and explore how such funds can encourage productive investment. Government should explicitly ask for evidence about best and innovative practice in other jurisdictions, and in particular how public sector pensions have been used to embed innovative approaches to infrastructure management, such as shown by the CDPQ, or in pooling funds to invest in infrastructure. Government should also consider why the Pensions Infrastructure Platform was less successful than projected.
Next chapterChapter 5: Creating Local Investment Opportunities
Chapters 2 and 3 highlighted clearly how Government can do more to harness pools of capital and encourage productive investment. However, these changes need to be married with the capacity to generate a pipeline of projects, and Government structures which can generate a supply of investable propositions.
Many of the projects contemplated will be part of the Levelling Up agenda, and its likely successor. This programme will require strong local institutions to be delivered. The Levelling Up White Paper set out ambitions to create a devolution deal in every region in England by 2030. One of the other major promises put forward in the White Paper was to rationalise funding streams and create a better, long-term framework for spending and borrowing.
However, the Government has not yet put forward plans to do this, and it remains one of the key sticking points in ensuring more autonomy for local communities, and to create accountability between electors and local areas rather than between local communities and Whitehall. Without long-term funding plans, it is also harder for local communities to drive forward investment projects
This chapter focuses on ways to both enhance local accountability, and create the conditions for which projects can be more easily approved and developed, so that the capital unleashed in chapters 2 and 3 can be directed towards UK projects.
Closing Gaps While Boosting Investment Overall
Aside from creating local pipelines, one of the key roles that local institutions will have to play is making sure that investment is spread more evenly throughout the United Kingdom. As shown in Chapter 1, persistent gaps have had a negative effect on the UK economy.
Moreover, the situation will not improve by spending more money from the centre. This would defeat both the purpose of encouraging more private capital and addressing the productivity challenges in the UK.
Here the UK should look to its past, where local authorities helped drive broad-based growth. Throughout the period of British economic dominance in the late 19th century, it was local government, and not central government that drove policy. This is partly because local Governments could experiment, work closely with business, and move at speed. As a former Chancellor of the Exchequer put it, it was important “to put as little on the Government whose overthrow causes a revolution as you can and to have as much as you can on the local bodies which may be overthrown a dozen times and nobody would be the worse”.281Davis, John. 263
Throughout this period, local government taxation increased more quickly than central government taxation. It was local government responding to economic change. Local taxation and expenditure actually increased faster than central taxation, meaning that while in 1840 local government accounted for 21.9% of total government expenditure, by 1910 it was 47.9 percent.282Daunton, 46 About 70% of taxes for local services were raised locally, and local businesses were tied to local services. For example, Manchester’s docks proved a very lucrative form of revenue, and Birmingham’s gas works contributed between £25,000-£30,000 annually283Equivalent to around £3,000,000 today., used in part to finance a museum.284Doyle, 295
In the hey of local Government, the UK experienced high levels of growth – but it was broad based and relatively evenly distributed. Compared to the last 20 years, the years between 1870 and 1911 were broad based. London grew much less quickly than the rest of the UK, and East Anglia, the East Midlands, the South East and West, and Ireland did particular well.285Geary, Frank and Stark, Tom. Regional GDP in the UK, 1861-1911: new estimates. 2015. Economic History Review. Link.
Figure 36: Change in GDP per Worker 1871-1911
In short, in order to harness best the investments heralded by the previous three chapters, the UK must adopt stronger local institutions and the ability to raise revenue locally.
Getting the Governance Framework Right
The most important responsibility for Government, if it wants to encourage collaboration with investors, is to simplify Governance arrangements in local areas.
Currently, UK local governance is both too small, too large and too disparate to be effective. Local authorities are ‘too large’ in the sense that they are often remarkably distant from the communities they serve.
They are ‘too small’ because there are over 300 local Government bodies across the United Kingdom, which report directly to national Government. There are few, if any, intermediate institutions between the local and the national in the UK. The closest equivalent is the combined authority. This is the level of Government that should continue to be empowered.
Combined authorities are vital because investment at scale – in the billions of pounds – occurs in functional economic market areas (FEMAs). Political governance for FEMAs should join with the economic area. Instead, the current patchwork in the UK looks like the following:

The Levelling Up White Paper sought to rectify this problem by creating tiers of devolution deal. This should have a significant positive impact. However, the Government must be committed to aligning, as much as possible, economic areas with political ones, and not necessarily letting existing political boundaries scupper entirely the point of combined authorities and combined county authorities.
The Government has alluded to this already by pushing for the integration of LEPs into existing structures. However, in future deals Government needs to underline the unison of political and economic areas.
Bigger Combined Authorities
Government would probably be wise to make its devolution deal mission in the Levelling Up White Paper more ambitious: instead of promising a devolution deal in every functional economic area or whole county area by 2030, Government could commit to promising a devolution deal for every functional economic area by 2030. This would involve Government working closely to get sometimes recalcitrant local authorities to work together, but it would create a set of uniform regional structures through which Government could devolve substantial economic power.
In the meantime, Government should not hesitate to use the powers in the Levelling Up and Regeneration Bill to expand combined authorities and better integrate FEAs and combined authorities. In particular, the trailblazing deal currently being negotiated in the West Midlands Combined Authority is a brilliant place to demonstrate how expanding combined authorities could work. The Levelling Up Bill specifies that existing combined authorities would be able to expand their boundaries with the consent of the local Mayor and the incoming local authority.172 This power should be used to encompass the full West Midlands FEA as it would show how urban and peri-urban areas can work together and integrate services and economic decision-making.
Recommendation 12: Government should expand its aim in terms of the Levelling Up devolution missions to encompass functional economic areas. Government should aim to, as much as possible, ensure that its devolution deals each encompass as wide an area as possible. This would align economic and political structures more effectively. It has already made it significantly easier to expand combined authorities in the Levelling Up and Regeneration Bill. These powers should continue to be used and Government should always aim for devolution deals to as much as possible cover wide areas. Government should, where appropriate also push for existing combined authorities to expand.
More Coherent Plan Making
The fiscal powers outlined in this report, as well as the investment which could potentially be unleashed are much less powerful, though, in the absence of more coherent regional plan making in the UK. One of the main aims of further fiscal devolution is to ensure that funding can be achieved at the right scale, and that investable projects at the right scale can be developed. However, this is hampered by the fact that current spatial and strategic planning operates over a devolved patchwork.
An Uneven Landscape
The planning landscape remains uneven in the UK particularly between the various combined authorities in the UK and their devolution deals.
As shown by the table below, the combined authorities in the UK have a variety of different powers and hierarchies. Moreover, these sit alongside a variety of powers at the district, county, borough, and national levels that intersect with combined authority powers, even if the combined authorities are themselves meant to help deliver economic objectives across a functional economic area. This leads to policy incoherence which can hamper investment.
In the West Midlands, for example, the current patchwork of powers leads to a mismatch of vision, resources and ambition:
Statutory responsibilities for planning, delivering and managing housing, highways, and sustainable transport sit across different tiers of Local Government outside of Unitary Authority areas. Even within unitary authorities these responsibilities can rest with different teams which in some cases can report to different Cabinet Members of the Authority. It was felt by stakeholders, particularly two-tier Local Authorities, that Transport and Planning Authorities/Departments can have differing priorities, resulting in housing and transport policies and plans that do not necessarily promote integration. Additionally, differing levels of ambition between neighbouring authorities was identified as providing a challenge to delivering a strategic vision for new development across functional economic areas.
The current local planning process, especially in areas with a local Mayor and areas with local planning powers can result in a political morass and undue political risk for major investments. In Manchester, for example, The Mayor has power over strategic planning but does not have much say in Local Plans, despite a duty to co-operate. Moreover, in London the Mayor can call-in planning applications, as can the Secretary of State, leading to two potential veto points.
This is even more bizarre in the context of the powers that Mayors have been handed – over brownfield development and land-use financing via Mayoral Development Corporations and Land Use Commissions. In Policy Exchange’s paper Rethinking the Planning System for the 21st Century, the author’s argued, the risk at the heart of the current planning system has discouraged smaller developers, and the overlapping planning functions has resulted in too many objectives and increased the cost of investment. More particularly, dynamic locations are constrained. By giving more planning power to Mayors in particular, the system could be rationalised, while also creating a coherent joining up of planning, transport, housing, and economic policy at the regional level. It should be noted that the National Infrastructure Commission has called for better long-term planning too, and this could be achieved by better Mayoral oversight.202
Recommendation 13: Government should commit to devolving the full suite of strategic planning powers, including the creation of statutory spatial frameworks and Levelling Up Innovation Zones to Mayors and combined authorities. The current patchwork of powers does not encourage coherent plan making, and Mayors who have power over regeneration, Mayoral development corporations and unlocking brownfield sites, sometimes do not have the leadership tools to drive forward better planning. Furthermore, investors must navigate a wide variety of different fragmented structures, depending on the area of the country. Finally, Mayors should be able to experiment with looser planning rules and designate areas for enhanced regulatory and fiscal incentives. This approach combines a uniformity of powers held by Mayors with the ability for local people to attract investment and create bespoke business conditions.
A Regulatory Opportunity in Local Communities
One of the key roles that Mayors possess, even if it is not part of their formal powers, is to encourage the creation of economic eco-systems. The previous Government suggested that Investment Zones might be a way to achieve this; they are now being reviewed. Even if they do not survive in their current form, investment zones do speak to the fact that local communities deserve more flexibility in how they design economic landscapes and encourage economic growth.
| Investment Zones: Government Prospectus286DLUHC & HMT. Guidance: Investment Zones in England. 24 September 2022. Link. |
| Investment Zones were announced by the previous ministry as part of the Growth Plan. The key offers here relate to planning and tax incentives.
Planning Benefits
Tax Incentives
Other Powers
|
The investment zones proposed that areas chosen would receive a specific growth settlement and potential strategic autonomy over Government funding. This is a welcome reform, as the current model of funding local authorities is highly dependent on central Government. Government should consider allocating specific funding to catalyse long-term investment in these areas, in a manner similar to the Long-Term Investment for Technology and Science (LIFTS) competition. LIFTS was announced in the growth plan and provides £500 million to catalyse pension and other institutional investment in life sciences.287HM Treasury. The Growth Plan 2022. CP 743. September 2022. Link.
Government should consider a similar catalyst model for infrastructure investment, predicated particularly on de-risking investment opportunities and ensuring propositions are investment-grade. As shown in the context of Solvency II, rateable, investment-grade ratings are imperative to ensure regulatory compliance. LIFTS faces a similar challenge: it must be able to de-risk in order for institutional investors to meet their regulatory obligations. Subject to a successful LIFTS roll-out, local mayors could create their own fund structures along the same lines, to facilitate both business and infrastructure investment.
Moreover, the ability to designate specific areas for greater collaboration or faster development should be welcome. In particular, Mayors should be able to designate, with central government, areas of potential regulatory collaboration. A good example of how this might work is in the Sheffield Olympic Legacy Park, which has been put forward as a potential investment zone.
| Case Study for a Potential Investment Zone: Sheffield Olympic Legacy Park |
| The Olympic Legacy Park in Sheffield was created as a redevelopment of the Don Valley Stadium in 2015.
The Legacy Park was formed as a company, Legacy Park Ltd, and is a partnership between Sheffield City Council, Sheffield Teaching Hospitals Foundation Trust, and Sheffield Hallam University. It also includes a technical college with 419 students, as well as the Oasis Academy Don Valley. It now includes a number of businesses and enterprises, and recently received a £14 million investment from Canon. The organisation expects a further £200 million in private investment over the coming years and will create 5,600 jobs.203 Alongside schools, the centre includes medical and sports research centres, building on the Olympic Legacy, as well as office space for startups and growing businesses. |
The Olympic Legacy Park is a smashing success – as it has created a pipeline of investable business and research propositions in a local area that had historically been underserved. The original plan was to redevelop using a £3 million grant from central Government.204 From the beginning, the project has involved developed strategic land use plans via the City Council, alongside investment championing through both the Council and the investment team at the park itself.
The Legacy Park now encompasses a food and sports science innovation eco-system, with a high potential for long-term investment by institutional investors, and an ideal setting for developing innovative regulatory approaches. Regulatory innovation could encompass two forms: on the one hand, Government should encourage financial regulators to work with businesses and institutional investors to consider how local areas can show investment grade propositions across an eco-system. On the other hand, Government can encourage industry regulators to examine local examples of innovation to develop future regulatory frameworks. For example, the Olympic Legacy Park operates in particular in the life sciences and food spaces, with Artificial Intelligence in particular. In these sectors, growth is impeded in part by a lack of regulatory frameworks, or non-collaborative regulators in these areas.
The point here is that local communities have the convening power to encourage collaboration, and this should be able to pull in national regulators.
Recommendation 14: Government should create a fund to catalyse infrastructure investment in Investment Zones modelled after LIFTS, and local leaders should be able to apply to pilot new regulatory approaches to prudential rules and to industry specific innovation challenges. The thinking behind investment zones should be applied more broadly if Government chooses not to proceed with them, so that local leaders are still able to convene national government functions and regulators to encourage innovation and investment.
A Pilot for Strategic Fiscal Autonomy?
Alongside a more innovative regulatory environment, Government should also acknowledge the lack of fiscal autonomy that local areas currently have, which corresponds to a relative lack of strategic initiative.
According to the latest data, the United Kingdom relies significantly less on taxation and significantly more on grants than any other country. The only country that comes close is Italy, which raises nearly 60% more proportionately in taxes, and slightly less than the UK in grants (because of less reliance on fees and charges than the UK). According to the latest OECD data, of all OECD countries, the UK raises less from taxes at the sub-central level than any other G7 country.
Figure 37: Local Taxation as a Share of Revenue
OECD
As a result of this fiscal imbalance, local Governments are responsible for delivering economic outcomes with resources delegated from Whitehall. As a result, communities usually end up at the mercy of Whitehall. As stated in a recent House of Lords report, local authorities have to respond piecemeal to various funding requests based on national priorities, not what local communities need.288House of Lords. Towns and Cities: Local Power is the Path to Recovery. COVID-19 Committee. 29 November 2021. Link. A recent academic study found that local Government did not look at interventions that communities most needed, but rather ones that they felt the UK Government would accept.
More importantly, the current model relies on a complex scheme of grants that make it hard to plan effectively and prevent resources being deployed at scale. This fragmentation has been long-standing. One study by the Local Government Association found that in the period between 2015 and 2019, there were over 200 separate grants for local Government, 117 of them competitive. The National Infrastructure Commission has recommended, since its 2018 National Infrastructure Assessment, that the Government should give local authorities greater control over funding and decision-making.
Investment Zones proposed single multi-year settlements for Investment Zones. Government should keep this idea and expand them to combined authorities. Multi-year funding settlements should accompany increased powers. Moreover, instead of keeping funding, local areas should be able to experiment with setting, designing and valuing local properties, and keep revenues across their local area. This flexibility is common in other countries, but virtually non-existent at the local level in the UK.
On top of this, the UK could design funding settlements that reflect local fiscal resources, rather than arbitrary funding competitions set in Whitehall. Here the UK could again look at the Australian and Canadian examples, where equalisation enable local autonomy while maintaining equality of services.289Roy-César, Édison, Canada’s Equalization Formula. Library of Parliament, Canada. 2008. Link.,290Commonwealth Grants Commission, GST Revenue Sharing Relativities: 2022 Update. March 2022. Link. This could invite a further considering of other taxes that might be devolved, like income tax or stamp duty.
In any case, this is a key area for further discussion, and Investment Zones, thanks to the range of tax incentives on offer, and the fact that many will be located in large, functional, Mayoral Combined Authorities, would be excellent places to pilot approaches that ensure true fiscal autonomy over a range of taxation. Policy Exchange aims to fulfil this research in the coming months.
Recommendation 15: Government should fully devolve business rates and allow combined authorities to design business rates and set reliefs and multipliers based on local criteria. Combined authorities should also be granted multi-year settlements. By fully devolving business rates, local communities would be incentivised to design a better tax system, pursue pro-growth policies since they can keep the increased revenue, and would be subject to some pressure to keep rates competitive. Competition between the combined authorities to have better business property tax regimes would provide impetus for reform and give avenues to simplify grant funding through needs-based top-ups, due to the disparate per head collection of business rates in different areas.
Next chapterChapter 6: Better National Collaboration
Chapter 5 dealt with how local institutions can help generate investable propositions to attract capital. There is also a strong case that the UK’s national institutions are also underperforming. This chapter examines how a set of different institutions, including the UK Infrastructure Bank, the Local Government Pension Scheme, the British Business Bank and the Business Growth Fund can better mobilise private sector capital. In each case, international best practice can tell the UK something about how to better Level Up, invest in Net Zero, and generate growth.
The key emphasis of this section is to encourage an economic model where national institutions can play a coherent role with investors to unlock investment opportunities. While the regulatory and market reforms made in Chapters 2 and 3 might unlock significant capital, they also require Government to create investment opportunities. Otherwise, investment may well go to other jurisdictions.
This section looks at
- The UK Infrastructure Bank
- Homes England
- Business Growth Fund
- British Business Bank
- Office for Investment
- Big Society Capital
- Rural Payments Agency
- UK Export Finance
And asks how these institutions can better mobilise public capital to create investment opportunities, and whether the currently highly fragmented structure enables collaboration at the highest levels between institutional investors and the Government.
The UK Infrastructure Bank
The UK Infrastructure Bank opened in June 2021. It was designed to replace the European Investment Bank, which served a similar purpose when the UK was in the European Union.
The UKIB is designed to deliver similar outcome and is structured like its international counterparts. The UKIB has a core mission:
to partner with the private sector and local government to increase infrastructure investment to help to tackle climate change and promote economic growth across the regions and nations of the United Kingdom.
And two strategic objectives:
- to help tackle climate change, particularly meeting the government’s net zero emissions target by 2050; and
- to support regional and local economic growth through better connectedness, opportunities for new jobs and higher levels of productivity.291HM Treasury and UKIB, UK Infrastructure Bank Framework Document. Link.
The Bank was set up relatively quickly, and as such it has not been able to fulfil its role as effectively as it could have done. For example, the amount of capital the Bank has lent is significantly less than its European predecessor. This is partly a result of the rules under which the UKIB operates and also the haste through which the UKIB was introduced. There remain significant gaps. The Government should take steps now to change the status quo.
Figure 38: EIB and UKIB Annual Lending (£bns)
UKIB Investment Principles – A Potential Barrier
The UKIB has four major investment principles.
- The investment helps to support the Bank’s objectives to drive regional and local economic growth or support tackling climate change.
- The investment is in infrastructure assets or networks, or in new infrastructure technology. The Bank will operate across a range of sectors, but will prioritise in particular clean energy, transport, digital, water and waste.
- The investment is intended to deliver a positive financial return, in line with the Bank’s financial framework.
- The investment is expected to crowd in significant private capital over time.292UKIB, Where we invest. 2022. Link.
These are straightforward and sound investment principles It is right that the UKIB should aim to crowd in private investment, and to deliver a positive financial return in cutting edge technology.
However, a significant potential problem exists, highlighted by recent debates on the UKIB in Parliament. One of the Government’s clear aims is to ensure that the UKIB does not crowd out private capital, that it should aim for additionality. This should mean that the UKIB invests in projects that otherwise would not have received private capital but for the UKIB’s involvement.
In a recent debate in the House of Lords, the Minister put it thusly:
the Government see their role as maximising the bank’s impact to focus on intervening where its additionality to the market is greatest and will limit its exposure to investments that could already be fulfilled by the private sector. The bank will have a higher risk appetite than the market where it sees that policy outcomes that the private sector has not considered can be achieved. However, it will also have to bear in mind the usual value-for-money considerations in doing this.293Houses of Parliament, UK Infrastructure Bank Bill [HL]. Hansard Volume 822: debated on Tuesday 24 May 2022. Link
The UKIB will have directors chosen by the Treasury. Its mandate will be set by the Treasury, and the UKIB Bill leaves significant provision for Government direction in the Bank’s direction.
However, if the Government is committed to additionality, this will likely clash with the third and fourth investment principles – to crowd in private capital and to deliver a positive financial return.
One of the points made by the National Infrastructure Commission in the original report recommending the creation of a UK Infrastructure Bank is that there is an “ongoing market failure” around innovative products – such as Net Zero products in infrastructure.294National Infrastructure Commission. National Infrastructure Assessment I. July 2018. Link.
As a result, many of the investments in which the UKIB may invest are either going to be high-risk, unrated, innovative, and likely, in some cases to lead to losses. Conversely, investments likely to secure a financial return are likely also to attract private sector investment. As a result, the UKIB will invest in projects that secure a return, but these are the very investments that the private sector may also find attractive. As such, Government will have to make a choice on whether it prioritises additionality or the ability to secure a return.
The Economist’s Trap
There is a risk of falling into the economist’s trap, which is when an economist finds a £10 note on the ground and does not pick it up, thinking it is not real. In this instance, the economists assumes that if the £10 note was real, someone else would have already picked it up, since it is a £10 note. The point here is that it is sometimes extremely difficult to model what the market will or will not invest in, and certainly extremely difficult to do so ex post. As already explored in relation to financial regulation, many infrastructure and Net Zero assets operate in underdeveloped markets, and so the ability to assess is curtailed further.
Given the success of the EIB, and the models adopted in other jurisdictions such as Canada, which do not prioritise additionality to the same degree, Government should be prepared to balance additionality against the other investment principles.
The UKIB has helpfully published an ‘Additionality Framework’295UKIB. Additionality of UKIB Investments: Our Approach. 31 October 2022. Link., which highlights key questions that will be considered by the bank in ex-ante additionality assessments. The Bank points out that ex-ante additionality judgements are not a ‘precise science’, and that each deal is assessed and rated on a ‘case-by-case’ basis. 296Ibid. It is also fair that the Bank will assess additionality as deals are made and develop a body of evidence over time.
H, as welcome as the additionality framework is, it does not assuage all uncertainty. In particular, one of the assessments mentioned – the commitment to “test the counterfactual”297Ibid., is not expansively laid out. The Bank has also not yet published how it will report ex-post assessments. In that context, the UKIB should aim to publish, within the next financial year, an assessment of how its ex-ante and ex-post assessments have aligned, and include within this assessment which forms of evidence, such as business plans, market analysis, industry reports etc. have been most accurate and useful for the UKIB. This will give potential investors certainty in how they can best evidence their projects and create a more stable engagement environment.
Ensuring Expertise is Provided
The UKIB has also only just started its advisory function for local authorities to help deliver infrastructure investment. This is an important role, but it is still in its infancy, with pilots only announced in September 2022.298UKIB. First pilots announced for new local authority advisory function. 29 September 2022. The National Audit Office noted that the function would be a “broad and challenging” one,299NAO, The creation of the UK Infrastructure Bank. Session 2022-23. 1 July 2022. Link. and it is crucial that the pilots in Bristol, Manchester and West Yorkshire are measured and lessons drawn.
It is to be welcomed, though, that the UKIB is looking first and foremost at Mayoral authorities and within combined authorities to deliver their expertise. Combined authorities exert a significant amount of strategic planning and investment influence in their local areas. Many are new. This is the right area to be prioritising.
The UKIB could contribute further to the development of combined authorities by also working with every area of Government on devolution deals. While not discussed explicitly in either the NAO Report or in the Bank’s Framework, devolution deals are crucial to unlocking investment in local areas, and so the UKIB should be in on the ‘ground floor’. Even more so, it is newer authorities that are likely most in need of expertise going forward. As a result, not only will the UKIB’s advice be comparatively more useful, but it would also embed relationships between investors, the Bank and newly devolved areas from their inception.
Recommendation 16: In the next financial year, the UKIB should publish an assessment of how well its ex-ante additionality criteria have functioned, focus on what evidence was most useful in assessing projects, and consider how ex-ante assessments align with ex-post outcomes. The UKIB’s additionality framework is a welcome step from the Bank, but it should consider now how to ensure potential investors are best able to show evidence under these assessments, and develop an evidence base for further refinement over the coming years. When working with local authorities, the UKIB should also prioritise newly created combined authorities, to ensure expertise is delivered from the outset.
Homes England
To improve the ability of the UKIB to deliver its mission over the long-term, Government should seriously consider its functions in relation to Homes England. The UK has a housing crisis – partly as a result of an inability to build homes thanks to a restrictive planning system. As a matter of fact, the current planning regime has been cited by Homes England as a major barrier to building more homes.300Homes England, Homes England Strategic Plan 2018-2023. 30 October 2018. Link.
The current planning system is one that requires housing and infrastructure needs to be built alongside each other, and where Local Plans must specify in detail a variety of different infrastructure constraints and needs. Simultaneously, the National Infrastructure Commission has noted in its recommendations that a number of Net Zero targets relating to infrastructure are dependent on upgrading the housing stock.301National Infrastructure Commission. Energy and Waste. 29 September 2022. Link.
Finally, like infrastructure, housing suffers from a deficit of developer finance, particularly for smaller builders.302Ibid. This results in weakened competition in the industry.
In short, the issues of housing and infrastructure are intimately related. The Bank’s Framework document has cited Homes England as one of the organisations with which the UKIB should sign a Memorandum of Understanding. The UKIB should prioritise this MoU and publish it at the earliest possible opportunity.
More importantly, the UKIB and Homes England should publish a joint strategy on how housing and infrastructure financing can work together. This would help build the communities and major developments of tomorrow. Indeed, projects like the Cambridge-Oxford Arc, appears to be indefinitely postponed, involved both housing and development planning.
Finally, over time, Government should consider merging Homes England and the UKIB to create a coherent and holistic Housing and Infrastructure Development Bank. This would assist local communities in developing integrated investment packages and align with the current planning framework. Government should also consider ways to ensure that Homes England and the UKIB, as entities designed to mitigate risk in investments, can assist in mitigating planning risk for Net Zero and other infrastructure projects. This might be through expedited planning once the UKIB and Homes England have considered projects viable, and through the Planning Inspectorate being required to apply weight to their involvement in projects.
Recommendation 17: The UKIB should prioritise developing an MoU with Homes England, and consider merging the two institutions to ensure strategic alignment across infrastructure and housing. Homes England and the UKIB should work in tandem wherever possible and should develop a joint strategy on housing development and infrastructure investment.
Consolidating a One Stop Shop for Businesses and Investors
On top of a merger of Homes England and the UKIB, the Government should also consider reforming and consolidating the variety of different organisations currently designed to support businesses.
At present, the Government has been involved in or is actively responsible for
- UK Export Finance
- Office for Investment
- Business Growth Fund
- British Business Bank
- Green Investment Bank
- FinTech Taskforce
- High Streets Taskforce
- Big Society Capital
- Rural Payments Agency
- Green Finance Taskforce
Each one of these organisations, amongst others, plays a role in helping businesses and investing in local communities. However, this is a fragmented landscape, and one not replicated with many of our closest partners. In other jurisdictions, one or two organs take up many of the tasks listed above.
In France, for example, export financing, business support and investment promotion are undertaken by BPIFrance; it calls itself the “bank for entrepreneurs”.303BPIFrance, Bank for French Entrepreneurs. 2022. Link. In the United States, the Small Business Administration oversees loans, supports rural businesses specifically, and offers export financing options. The most famous example of a wide-ranging bank, KfW304Kreditanstalt fur Wiederaufbau, or ’Credit Institute for Reconstruction‘, originally. promotes German investments abroad, invests in infrastructure and businesses directly and through intermediary institutions, and finances exports. All of these banks also committed more than the British Business Bank in the year prior to the pandemic.
As shown by the below chart, the British Business Bank in 2019-2020 managed £8.5 billion, compared to £65 billion at the KfW, £121 billion through the Small Business Administration, and £31 billion through BPI France (which had just been set up).
This is not a criticism of the British Business Bank per se, as its remit is slightly different. The British Business Bank does not lend directly. Its mandate is instead to increase the ‘supply’ of finance through third party institutions.305British Business Bank. What we do. 2022. Link. Moreover, these other organisations provide lending to a variety of businesses in different contexts. The Green Investment Bank invests in Net Zero projects, the Business Growth fund aims at venture capital, etc. Unfortunately, many are not directly sponsored by the Government. The Green Investment Bank was spun off in 2016, the Business Growth Fund was an initiative of private banks with Government support, and Big Society Capital was a private initiative via Project Merlin.
While each of these initiatives was important on its own, the result has been a highly fragmented environment.
Clear Access to Pools of Capital
As a result, the overwhelming sense on the British landscape is that the current arrangements are too complicated. Some entities invest in green finance, others in venture capital, the British Business Bank only via lenders. The British Business Bank will help a firm grow, but it must then move to UK Export Finance for support in selling goods and services abroad. Nevertheless, the British Business Bank should seek to expand its remit and open more branch offices. Both the US and French equivalents have more than 40 offices each.306Small Business Administration, SBA District Offices. Link.
,307NEFI, Bpifrance. Link.
Meanwhile, there remain significant gaps in regional finance. Anecdotally, one firm we spoke to found that investment firms in the North of England (where the company was based) were less professional and offered half the valuation of investment firms in London. This is also borne out by the evidence. While the British Business Bank’s Enterprise Finance Guarantee has an overrepresentation of firms from outside London and the South East, London accounts for 47% of deals and 66% of investments by volume in equity.308British Business Bank, Small Business Finance Markets. 2021. Link. It is worth pointing out here that on the credit side, the British Business Bank has few competitors, while on the equity side there are many entities aiming to do similar work. The case for bringing equity pools of capital closer together is strong.
Facilitating Private Investment
Alongside this fund, the British Business Bank should also consider its role in facilitating productive finance on the part of institutional investors. In particular, the British Business Bank could play a more expansive role in ensuring small and medium sized businesses are rated, and therefore investable propositions for institutional investors bound by prudential rules.
The British Business Bank could also further incentivise investments by developing a rating mechanism for growth businesses, businesses which deal in new net zero industries and other SMEs which lack access to ratings. As stated in the Chapter 4, currently access to external ratings can pose a significant barrier to access to institutional investment. The Banque de France already provides ratings to firms via the ‘Fiben’ database.309Banque de France, Banque de France ratings. May 2022. Link. The British Business Bank could consider ways to expand ratings access to businesses and innovative industries, by working with prudential regulators to expand availability of ratings in emerging industries and start-ups.
Furthermore, the British Business Bank could consider how working with private sector partners it could trial innovative approaches to DC pension and insurer investing. The British Business Bank has already shown an interest in UK DC pension funds, and how they can contribute to growth equity.310British Business Bank. The Future of DC Pensions: Enabling Access to Venture Capital and Growth Equity. September 2019. Link. The BBB’s estimate is that a 5% investment in the UK’s fastest growing companies can also increase retirement savings by 7-12%.311Ibid.
Government has introduced a Long-Term Asset Fund to encourage DC pension investment in these kinds of assets, but there are still challenges in ensuring funds are accessible. As British Patient Capital has noted, “these are complex challenges which need a coordinated approach from the industry and government to solve”.312Lewis La Torre, Catherine. Response to the Future of Defined Contribution Pensions Report. 25 September 2019. Link. Indeed, the FCA has recently closed a consultation looking at expanding the retail distribution of the LTAF, and considering ways to expand illiquid investment opportunities.313FCA. Broadening retail access to the long-term asset fund. 1 August 2022. Link. Government has announced the LIFTS vehicle in the Growth Plan, but Government should also consider ways in which innovative fund structures could also be embedded into the British Business Bank’s framework. This would also be a way to encourage regulatory innovation with Government support, and embed a forward looking approach to fund regulation in the long-term.
The British Business Bank, and British Patient Capital, offers an excellent node through which to encourage investment in long-term growth equity. As Government-sponsored agencies, BPC and the BBB would be an excellent venue through which to trial different regulatory approaches to funds, and to work directly with institutional investors in insurance and pensions to identify and address potential barriers.
Recommendation 18: The British Business Bank should launch an investment vehicle specifically to encourage co-investment with institutional investors who face specific regulatory burdens, like pension funds and insurers. The British Business Bank should use this investment fund to encourage regulatory innovation and work in conjunction with the relevant regulators, to specifically identify barriers and trial new regulatory approaches. Government capital could be used to de-risk these investments. The BBB should also look to take a more coordinating role with other quasi-public organisations, such as the Green Investment Bank and the Business Growth Fund.
Creating an Institutional Growth Fund
Alongside a stronger role for the British Business Bank in rating and making investable assets, Government should lean into the capital unlocked by Solvency II regulatory change, and mobilise a new, private-sector fund along the lines of the Business Growth Fund (BGF) created in 2011.
The BGF was created in 2011 from capital raised from the major UK banks in the aftermath of the financial crisis. It was created specifically to address funding shortfalls in the aftermath of the financial crisis and in particular to deal with the long-term equity funding gaps in the UK economy.314Miedema, Douwe and MacLellan, Kylie. UK small business fund looks to fill bank gap. 16 May 2012. Link. The BGF operates as the minority shareholder in companies across the United Kingdom and Ireland, providing a long-term funding approach. As of 2021, it achieved a 23.4% gross internal rate of return on its exits, and 72% of its capital is invested outside of London; £3 billion of growth capital has been deployed.315BGF, A decade of powering growth: Annual Report 2021. 2022. Link.
The BGF model meets a few key tests
- Commercial, driven by world-leading investors
- Convenes private sector actors to address long-term economic challenges
- Delivers for small and medium-sized businesses
The BGF model brings together bank capital and was specifically created in the wake of regulatory change after 2008. Government could seize the opportunity of pension and Solvency II reform by working with institutional investors to create a larger, similar structure for growth equity and venture capital. £15 billion would amount to 0.43% of pension assets, or 0.7% of total UK Solvency II insurance exposure. In either case, a small amount of funding could deliver significant returns for the UK economy.
One key difference here, though, will be the need for Government to underwrite the risk of the vehicle to ensure insurers and pensions can invest in line with their regulatory commitments. Like BGF, investors would be able to retain seats on the board. Whatever Solvency II or pension reforms are brought forward, pensions and insurers will require assured cash flows for regulatory purposes. As such, while Government should not invest any money directly, it should be willing to underwrite the risk of the vehicle to maintain an investment grade fund for regulatory purposes. To acquire the £15 billion, Government should also consider inviting foreign pension, insurance, and sovereign wealth funds to join the facility. Not only will this unlock additional capital, it would also be an opportunity to share best practice with world-leading institutional investors.
Recommendation 19: The British Business Bank should work with regulators to expand access to institutional investment for small and medium sized firms. Currently, many small and medium-sized businesses find it difficult to access institutional investment because they have difficulty accessing credit rating services. Government should use British Business Bank expertise to expand rating services, and work with regulators to expand eligibility for ECAI to a greater range of private market initiatives.
Recommendation 20: Government should use the opportunity provided through regulatory change to create a new, larger, Institutional Growth Fund, modelled on the Business Growth Fund. This fund would convene pension and insurance capital to deliver long-term equity funding in a commercial vehicle. This would create a minority-investor strategy investment facility underwritten by Government to ensure private-sector buy in, while also delivering the long-term growth horizon pensions and insurers need and which can close the funding gap within UK growth companies.
Next chapterConclusion: Opportunities for the Taking
The UK has immense economic and financial potential at its fingertips. However, there remain significant barriers to achieving this potential.
There are clear regulatory barriers, which the Government is already addressing through Solvency II reform, and the powers in the Financial Services and Markets Bill. However, these new powers must be used wisely and robustly. Government must develop a strong working partnership with industry and the regulatory authorities to achieve significant capital release.
There are a number of areas where the investment regulations can be improved. It should be easier for insurers to invest in alternative assets, and it should be easier to include them in the MA. The Prudent Person Principle should be developed further – it is already used extensively, but it is currently both too vague and too based on judgement to form a strong basis for a flexible yet prudent regime.
Growth and international competitiveness will be key concerns for the next Government, and they should be at the centre of regulatory concerns as well. Making growth a primary objective for the PRA and FCA would help drive cultural change and hopefully create a more collaborative atmosphere. In the same vein, loosening charge cap rules will encourage a wider range of pension investments.
Government should not deregulate at all costs, far from it. As shown by the examples of Canada and Australia, the UK can do much more to ensure pensions both invest in alternative assets and achieve better results for consumers. Consolidation should remain a key focus for Government, and it should be accompanied by a keen desire to continue competition within the pension industry.
Similarly, Government should look to the Canadian model to see how public sector pensions can be better mobilised to invest in infrastructure, private equity, credit markets and other forms of productive finance that generate significant economic returns for both the country and for investors.
These may seem like arcane debates about financial regulation, but these debates are in fact vital to driving stronger economic performance in the United Kingdom and Levelling Up regions across the UK. If UK pension funds invested in alternatives at the rate of the other major pension markets, hundreds of billions could potentially flow to productive assets. Similarly, in insurance the UK can and should do more to diversify exposure.
This does not mean, however, that regulation is the only element that needs to change to unleash capital. Government institutions at the national and local level need the tools to create investment opportunities. Reforming Solvency II and pension markets won’t themselves lead to UK investment – it will only release capital that could go anywhere in the world. In a highly competitive international world, it is vital that the UK Government attracts that capital here.
That is why Government must think strategically about its institutional set-up and ensure every organ of the UK Government is well-positioned to collaborate. At the moment, the organisational framework is too fragmented to be effective. Where there has been an effective attempt, such as the UK Infrastructure Bank, there is sometimes great reticence in crowding-out private initiative. This is less of a worry than it appears. Government should not be reticent to use the tools at its disposal to drive investment.
Overall, this report has presented a picture of a government and regulatory system that needs to get out of the way where it must, and must step-up where it should. This is not a report that advocates complete laissez-faire nor is it a report that advocates a state-led approach to improving the UK economy. Instead, it argues that the UK Government can be a better partner and a better catalyser than it is currently.
Great Britain has had a difficult decade. The next decade need not be. Government can take the steps now to improve the investment landscape and unleash capital in every corner of the United Kingdom. There is not a moment to lose.
Next chapterSummary of Recommendations
Strategic Priority 1: Creating a Better Regulatory Environment
Government should prioritise a regulatory environment for the financial sector that encourages diversification, policy holder returns, and balances financial stability with competitiveness and growth.
Recommendation 1: Government should proceed with Solvency II reform but should take care to ensure that any changes lead to investment in productive assets. Currently, there is a worry that the current approach to Solvency II reform may not deliver changes needed or desired by either the Government, industry or regulators. While significant progress has been made, Government should continue dialogue and seek to ensure the best outcome from reform, especially in relation to the risk margin, the fundamental spread and the matching adjustment.
Recommendation 2: The PRA should publish transparent criteria for the acceptability of internal rating models relative to ECAIs. Furthermore, the PRA could include transparent criteria for eligibility in the MA for most asset classes and accelerate eligibility decisions for more complex assets. The PRA should work with industry to develop transparent assessment criteria for complex assets also.
Recommendation 3: Government should work with regulators to develop a transparent, holistic and applicable test for Prudent Person Principle, which could enable investment in alternative assets. This should be aimed at ensuring that firms have the correct procedures in place to invest in innovative assets, rather than requiring a specific test every time a new innovative asset is considered for the matching adjustment.
Recommendation 4: Government and regulators should be more ambitious in reducing and simplifying Solvency Capital Requirements as part of Solvency II reforms. At the very least, the UK should aim to match the European Union in terms of reforms to the Long-Term Equity eligibility requirements, and it should look seriously at reducing the SCR for real estate investments. This will help secure long-term funding for businesses and development.
Recommendation 5: Government should make growth a primary objective and keep international competitiveness a secondary objective in the Financial Services and Markets Bill. This change would ensure that growth impacts are given equal weight, while also vitiating any potential ‘race to the bottom’. To ensure that a regulatory shift does occur, both the FCA and PRA should publish an explicit statement outlining how their secondary objectives will be incorporated and balanced.
Recommendation 6: Government should work with regulators to ensure regular review of the statutory objectives are scheduled under 27(3RB) of the Financial Services and Markets Bill. This would ensure that regulation will always be up to date and provides a minimum level of assurance that rules will be regularly reviewed in a meaningful way. It will also ensure that policy can be updated at regular intervals and new developments can be captured potentially more quickly than they would be otherwise. Government should also consider allowing the National Audit Office to independently review the work of the PRA and the FCA and whether they are meeting their statutory objectives effectively.
Recommendation 7: Government should proceed with excluding performance fees from the charge cap. It should expand this exclusion to include the fixed element of carried interest fees. Government should also work with the asset management industry to explore other fee performance models. This would ensure that the charge cap does not prevent DC pension schemes from investing in certain classes of illiquid and alternative assets altogether, especially venture capital and private equity. Government should ensure that a variety of different forms of alternative asset are legitimate choices for pension schemes, unhindered by different performance fee structures, other than competitive pressure.
Strategic Priority 2: Making Better Pension Markets
Government should prioritise reforming and consolidating the pension market. The UK should look to international comparators, such as the Netherlands, Canada and Australia to find examples of strong pension markets that invest in alternative assets and contribute to economic growth.
Recommendation 8: Government should launch a consultation into identifying and reducing particular administrative burdens which hinder consolidation, and in particular examine ways to expand the Value for Members test to schemes over £100 million, and to strengthen government powers in relation to winding down failing schemes below £100 million. Pension consolidation is one way to increase pension investment in alternative assets, and secure better returns for members.
Pension consolidation in Australia has been used to improve outcomes for consumers and to maintain high standards of investment. The UK should look to its example when designing its own pension system, and in particular aim to replicate the same consumer. This can be done by reducing the regulatory burden of consolidation, establishing performance benchmarks via the incoming pension dashboards, and improving member choice in pension schemes.
Recommendation 9: Government should use new ‘have regard’ powers in the FSM Bill to encourage consolidation. Consolidation should be entrenched as a key aim of pension regulators going forward. The FSM Bill would give Government additional means to embed these aims within regulatory priorities.
Recommendation 10: Government should look to consolidate the current Local Government Pension Scheme investment pools further and create a centralised body of oversight, including potentially phasing out the current pension board model. Instead, Government should consult on a new pension model that examines closely the Canadian public sector defined benefit model. Government should aim for a pension structure that encourages long-term investing with minimal political interference. The pensions board should be managed by leading investment professionals and Government should undertake an international talent search.
Recommendation 11: Government should issue a call for evidence on shifting to public sector funded pensions and explore how such funds can encourage productive investment. Government should explicitly ask for evidence about best and innovative practice in other jurisdictions, and in particular how public sector pensions have been used to embed innovative approaches to infrastructure management, such as shown by the CDPQ, or in pooling funds to invest in infrastructure. Government should also consider why the Pensions Infrastructure Platform was less successful than projected.
Strategic Priority 3: Empowering Stronger Local Government
Local Government in the UK is fragmented and weak compared to its international peers. Government should look to devolve powers to local communities that reduce political risk increase the ability of local communities to fund local projects with their own resources.
Recommendation 12: Government should expand its aim in terms of the Levelling Up devolution missions to encompass functional economic areas. Government should aim to, as much as possible, ensure that its devolution deals each encompass as wide an area as possible. This would align economic and political structures more effectively. It has already made it significantly easier to expand combined authorities in the Levelling Up and Regeneration Bill. These powers should continue to be used and Government should always aim for devolution deals to as much as possible cover wide areas. Government should, where appropriate also push for existing combined authorities to expand.
Recommendation 13: Government should commit to devolving the full suite of strategic planning powers, including the creation of statutory spatial frameworks and Levelling Up Innovation Zones to Mayors and combined authorities. The current patchwork of powers does not encourage coherent plan making, and Mayors who have power over regeneration, Mayoral development corporations and unlocking brownfield sites, sometimes do not have the leadership tools to drive forward better planning. Furthermore, investors must navigate a wide variety of different fragmented structures, depending on the area of the country. Finally, Mayors should be able to experiment with looser planning rules and designate areas for enhanced regulatory and fiscal incentives. This approach combines a uniformity of powers held by Mayors with the ability for local people to attract investment and create bespoke business conditions.
Recommendation 14: Government should create a fund to catalyse infrastructure investment in Investment Zones modelled after LIFTS, and local leaders should be able to apply to pilot new regulatory approaches to prudential rules and to industry specific innovation challenges. The thinking behind investment zones should be applied more broadly if Government chooses not to proceed with them, so that local leaders are still able to convene national government functions and regulators to encourage innovation and investment.
Recommendation 15: Government should fully devolve business rates and allow combined authorities to design business rates and set reliefs and multipliers based on local criteria. Combined authorities should also be granted multi-year settlements. By fully devolving business rates, local communities would be incentivised to design a better tax system, pursue pro-growth policies since they can keep the increased revenue, and would be subject to some pressure to keep rates competitive. Competition between the combined authorities to have better business property tax regimes would provide impetus for reform and give avenues to simplify grant funding through needs-based top-ups, due to the disparate per head collection of business rates in different areas.
Strategic Priority 4: Building More Collaborative National Institutions
Alongside better local institutions, Government can also improve how it collaborates on the national level. Institutions like the British Business Bank, the UK Infrastructure Bank and Homes England can use their roles to create a better national environment, and leverage pools of capital.
Recommendation 16: In the next financial year, the UKIB should publish an assessment of how well its ex-ante additionality criteria have functioned, focus on what evidence was most useful in assessing projects, and consider how ex-ante assessments align with ex-post outcomes. The UKIB’s additionality framework is a welcome step from the Bank, but it should consider now how to ensure potential investors are best able to show evidence under these assessments, and develop an evidence base for further refinement over the coming years. When working with local authorities, the UKIB should also prioritise newly created combined authorities, to ensure expertise is delivered from the outset.
Recommendation 17: The UKIB should prioritise developing an MoU with Homes England, and consider merging the two institutions to ensure strategic alignment across infrastructure and housing. Homes England and the UKIB should work in tandem wherever possible, and should develop a joint strategy on housing development and infrastructure investment.
Recommendation 18: The British Business Bank should launch an investment vehicle specifically to encourage co-investment with institutional investors who face specific regulatory burdens, like pension funds and insurers. The British Business Bank should use this investment fund to encourage regulatory innovation and work in conjunction with the relevant regulators, to specifically identify barriers and trial new regulatory approaches. Government capital could be used to de-risk these investments. The BBB should also look to take a more coordinating role with other quasi-public organisations, such as the Green Investment Bank and the Business Growth Fund.
Recommendation 19: The British Business Bank should work with regulators to expand access to institutional investment for small and medium sized firms. Currently, many small and medium-sized businesses are ineligible for investment because they have difficulty accessing credit rating services. Government should use British Business Bank expertise to expand rating services, and work with regulators to expand eligibility for ECAI to more businesses.
Recommendation 20: Government should use the opportunity provided through regulatory change to create a new, larger, Institutional Growth Fund, modelled on the Business Growth Fund. This fund would convene pension and insurance capital to deliver long-term equity funding in a commercial vehicle. This would create a minority-investor strategy investment facility underwritten by Government to ensure private-sector buy in, while also delivering the long-term growth horizon pensions and insurers need and which can close the funding gap within UK growth companies.
Next chapterAppendix 1: Asset Allocation for DC Master Trusts[
Taken from Corporate Advisers, data ending . Link. Accurate as of end of FYE 2019.