


Content
+
-
- Lesson 1: A strategy is needed, but not necessarily a plan.
- Lesson 2: Drop the search for a silver bullet: there needs to be a package of measures.
- Lesson 3: Fiscal prudence is usually a necessary but insufficient condition for transformation.
- Lesson 4: Low inflation helps, but on its own it is not decisive.
- Lesson 5: Tax can matter immensely – not always, but often.
- Lesson 6: High rates of investment are usually critical: except temporarily, this requires high rates of national saving.
- Lesson 7: Competition is the key driver of efficiency: openness to international trade is a major element, but not the only one.
- Lesson 8: Once the basics of sound macro policy are in place, the reform agenda must be focused on a series of micro measures.
- Lesson 9: Leadership is crucial: but success requires more than the contribution of one key individual.
- Lesson 10: Early successes and a clear vision for the future are key to retaining political support.
- Getting through the political barriers
Foreword
Professor Leszek Balcerowicz
Former Minister of Finance and Deputy Prime Minister of Poland, and former President of the National Bank of Poland
After the collapse of the Soviet Union, which enabled the fall of communism in Central-Eastern Europe, Poland had a historic chance to change its political and economic system. The Polish economy was not only struggling but was in ruin, with Poland’s GDP per capita being lower than some African countries. Inflation amounted to 245% in 1989 and 568% in 1990. In the 1980s Poland was a recipient of humanitarian aid from the West. The situation was utterly dire. But as this powerful Policy Exchange report sets out, the economic reforms we introduced in the 1990s were crucial in setting Poland on a path towards rapid economic growth and radically higher living standards.
There is no silver bullet or generalisable blueprint for economic transformation. Each political leader must think hard about the characteristics of their own economy: what its particular affliction is, and what medicine therefore ought to be administered. We opted for a radical stabilisation and liberalisation programme in 1990. This direction has been pursued by successive governments, but at different speeds. The first element of the reform was stabilisation – curbing inflation. The second, even more fundamental was institutional transformation – including privatisation, liberalisation of the economy and as a result introducing domestic and external competition. It included, perhaps most importantly, a transformation in the role of the state which included radically shrinking the power of the central government vis-a-vis the economy and society, and the creation of genuine local government.
As a result of these reforms, between 1990 and 2022 Poland was the second fastest growing economy in Europe, after Ireland. From 1990 to 2022, Poland’s GDP per capita PPP grew by more than 220%, with an average real economic growth rate maintained at about 3.5% annually. The early adoption and fast pace of the reforms made it possible to outperform other post-socialist countries that delayed changes.
However, transformation cannot be taken for granted. Recent years have seen dangerous reversals of the reforms that enabled Poland’s leap forward. Increasing expenditures on social programmes, the halt of privatisation and weakening of the rule of law raise concerns about a return to the inefficient practices of the past. Let us hope that the new government will continue the necessary reforms.
What might be learned from the Polish experience? The authors show how many features of Poland’s economic transformation were evident in other cases of rapid economic growth. Strong leadership, a cadre of motivated allies, a strategy for change which recognises the trade-offs required and assesses the battles that need to be fought – all of these things have been common to successful projects for economic transformation. And they remind us that the politics of delivering growth is just as important as the individual policies.
Policy Exchange’s Policy Programme for Prosperity asks exactly the right questions about how to turn a nation’s economic fortunes around, and I commend this first paper in the series to the reader.
Next chapterPolicy Exchange’s Policy Programme for Prosperity
The economic performance of the UK economy has deteriorated over the last decade and a half compared to its performance beforehand. Admittedly, after the Global Financial Crisis (GFC) of 2007/9, productivity growth deteriorated pretty much everywhere, suggesting that there was some common factor at work caused by the GFC. Along with Italy, however, the UK has done especially badly. Moreover, on key measures such as output per hour worked, the UK was a poor performer even before the recent deterioration.
Nor are there serious grounds for optimism about the outlook. Unless there are fundamental reforms of the economy, the most likely scenario is that the UK staggers on with very low growth, meaning very low rates of increase of living standards, as well as a continual slide down the international economic league tables, implying a weakening of British influence in world affairs.
Without a much stronger economy, the ambitions of politicians of all parties for a better economic future for our citizens will come to nought. Yet neither of the main political parties has a properly worked out plan of action to improve the economy – or even any prospect of developing one.
Our economic problems can be summed up in a single word: productivity. Everyone knows this but doing something about it is a different matter. Typically, political parties never really have a strategy for improving the level and growth rate of productivity, not least because they do not have the time to devote to thinking clearly about the problems and assessing possible solutions.
Every so often, politicians and others come up with a bold sounding mega solution that is supposed to bring salvation. But it never arrives. Either the vision is too narrow, or the supposed solution is too difficult to enact, or it is watered down, or it fails to address more than a fraction of the problem, or it ignores basic economic reality.
To have a hope of improving our performance on productivity we have to get to grips with the many factors that are holding it back. What is needed is a radical look at the underlying problems of the economy and a set of clear-eyed radical proposals to deal with them. That is exactly what this Policy Exchange programme aims to provide.
The Vision
The philosophy that underpins this venture is one of belief in the market economy. But this does not mean that there is nothing for government to do in both a micro and a macro sense. In fact, in much of the private sector economy – from housing to childcare to energy – government is integrally entwined in the functioning of these markets. Indeed, the very fact that this study is directed towards constructing an agenda of action for government should make it abundantly clear that it is not simply a panegyric to the market economy.
Some of what is wrong with the British economy is of the state’s own making; some is not. Either way, when things are as malformed and malfunctioning as they are in Britain today, leaving everything to the market will deliver, at best, the most efficient in the circumstances path to decline and disappointment. Even if an efficient and prosperous future involves more use of market mechanisms, the market alone will not be able to get us to this result. This will require a programme of action by government. That is what this Policy Exchange initiative is designed to construct.
Much of what will be discussed will be controversial – as will be its conclusions and recommendations. It will not be possible to produce the answer, which everyone accepts. But in advancing both a diagnosis and a prospective cure, at the very least this venture can hope to spark a serious debate about British economic policy and what needs to be done to improve the performance of the British economy.
Micro and macro
Sometimes, what holds a country back is essentially macro: for instance, excessive inflation, high public deficits and debt, politicised monetary policy, or an inappropriate exchange rate. There are elements of this list of macro problems in today’s economic situation in the UK but, in our view, they are not the dominant causes of poor economic performance. Once the current inflation spike has been dealt with, inflation should cease to be a major problem in the economy and the regime for deciding monetary policy, although it has its flaws, is a big improvement on the regime of politicised monetary policy-making that ruled before. Public debt is excessive but there is a plan to bring it down as a share of GDP. The exchange rate is not egregiously mispriced and the current floating rate regime is right for the UK.
Rather, the British economy suffers from a series of micro problems in each major sector. In some respects, serious problems are shared across all sectors but in many cases they are peculiar to a particular sector. Accordingly, this study takes a predominantly sectoral approach. It concentrates on key sectors of the public sector where poor performance is of major relevance to the economy overall – the NHS, the benefits system, crime and the justice system – and areas of the private sector where there is room for huge improvement – housing being a key example.
Two key macro subjects influence all sectors and are in turn affected by them, namely the level and structure of taxation and the level and type of real investment. They are covered in separate chapters. Nevertheless, the examination of major micro failings in the various sectors of the economy is relevant to them as well.
If we are to achieve and sustain a much lower rate of taxation, this will require a lower share of government spending in GDP. This will require a re-imagining of the role of the state across various sectors and a drive towards efficiency. Simply imposing across the board cuts would be stubbornly opposed, would lead to gross inefficiencies and would probably in time be reversed. Equally, sorting out the various micro problems of the economy can play a critical role in boosting real investment.
Our final chapter will draw together lessons from what has gone before and assess the relative importance of the sectoral failings that we have identified and the relative size of the benefits of the reform programmes that we have laid out. While it would be possible for governments to take a smorgasbord approach to a programme of reform and adopt one or more of our suggested measures because they seemed appropriate and/or doable, we try to show how the different areas of our programme are related and make some suggestions about inter-relationships and about sequencing.
The first subject that we address is the international evidence on how countries can achieve an economic transformation. We all know that economic transformation is difficult. Indeed, there is widespread pessimism about British governments ever being able to achieve anything at all. Yet there are a number of examples of countries being able to deliver just this. These cases are often trotted out as examples that the UK should follow. So, a study of these experiences is a good place to start our review of a detailed economic policy programme for the UK. If they can do it, why can’t we?
Next chapterIntroduction to Economic Transformation: Lessons From History
There are many examples of countries that have achieved dramatic economic transformations. Our intention here is not to produce a definitive, all-embracing examination of all of those examples. Rather, we want to examine a variety of different cases of economic transformation occurring at various points in the post-war period to see what key messages they may have for the UK today.
Accordingly, we do not examine the case of the dramatic transformation of the Chinese economy after 1978, nor of the later take-off of the Indian economy, nor umpteen other examples of drastic economic improvement in Asia or other parts of the emerging world. Those countries’ circumstances were both individual and radically removed from those that confront the UK today.
Rather, our main focus is on relatively developed economies in the west, although for reasons that should become obvious once readers have digested the sections on these economies, we do include Hong Kong, Singapore and South Korea.
Similarly, the study of economic recovery after the collapse of communism is a large subject on its own and we have neither the space, nor the need, to delve deeply into this area. However, we have thought it useful to look at one successful post-communist country, namely Poland.
Arguably, we should have extended our study to include Australia and New Zealand, both of which have undergone substantial reforms of economic policy. But our list of countries was already long and we had to draw a line somewhere. Nevertheless, in later sections of this study, we will make reference to these countries’ experiences.
This study of different countries’ experience of transformation examines the following examples:
- Mrs Thatcher’s Britain – Turning the Country Round: 1983-2007.
- Germany after the War – The German Economic Miracle: 1945-1973.
- France after the War – The Thirty Glorious Years: 1945-1973.
- Ireland – “The Celtic Tiger”: 1981-2020.
- Poland – From Communism to the Market Economy: 1990-2020.
- South Korea – Interventionism plus Competition: 1963-2007.
- Hong Kong – The Free Market Rules: 1962-1988.
- Singapore – Capitalism with Socialist Characteristics: 1959-2007.
For purposes of comparison, we show in Table 1 how these countries compare in regard to the growth of GDP per capita, presented as decade averages, starting in 1950.
Each of these cases is different. The aim is to draw out whether there are any shared themes which might be of relevance to the British case. There is a great deal of published material on these examples, and we draw on it, as well as conducting some original research. In particular, we try to draw out the answer to what we consider to be some key questions which may have a major bearing on the British case:
- Was the transformation achieved in these examples the result of a pre-envisaged plan by the Government in question?
- How long into the period of transformation was it before major advances were discernible?
- To what degree did the programme of economic transformation create losers as well as winners and how was political support sustained?
- To what extent did transformation involve a fundamental restructuring of the economy as opposed to doing the same things better? Was the dominant thrust of reform macro or micro?
- What was the sequencing of the various changes that took place to make the transformation happen and was the sequencing adopted in practice in accordance with how things were originally envisaged? Was this sequencing ideal?
- To what extent did the transformations involve higher savings rates by households and/or the whole economy?
- To what extent was the transformation the work of one key person?
Summary and Conclusions
- The episodes of economic transformation that we have examined are purposely both diverse and distinctly different in economic circumstances from those that confront the UK today. Because of these differences, unsurprisingly, there is no single blueprint that emerges for the UK to follow. Nevertheless, there are many suggestive aspects of these countries’ experience that provide food for thought about what can be done to improve the UK’s economic performance, and these lead on to some key lessons for the UK, as discussed below.
- Most importantly, the experience of these countries should issue a sharp rebuke to all those in the UK who regard it as next to impossible for us to achieve a marked improvement in economic performance. In most of the cases examined, economic transformation would have been regarded as highly unlikely when the process of improvement began. This is clearly true of the Asian cases of Hong Kong, Singapore and South Korea.
- Closer to home, it was by no means obvious that Ireland would be able to achieve the dramatic increases in GDP per capita that it did in fact achieve. In retrospect, it may seem obvious that Germany would recover much of its pre-war pre-eminence in key sectors, but it didn’t seem obvious at the time. Much the same is true of France.
- Meanwhile, Poland’s success has come as a surprise to most analysts – although it has had the EU level of prosperity and EU practices to converge on.
- All these cases are ones where either something dramatic had happened (France and Germany) or they were so far behind the leaders in development (Hong Kong, Singapore, South Korea, Ireland, Poland) that they had a clear path ahead. The UK’s present case in very different in that nothing dramatic has happened – just a slow relative decline. Accordingly, you might easily conclude that these other countries’ experience – particularly that of France and Germany recovering after the war – is of limited relevance to the UK’s case today. But we think this is would be a mistake. These two countries provide a rich fund of experience about the political economy of radical reform programmes and the relative roles of leadership and a sense of common purpose in achieving results.
- Nevertheless, perhaps the most encouraging experience for the UK now is the UK’s own transformation during the 1980s. When Mrs Thatcher was elected in 1979, there was widespread pessimism about the UK’s prospects. Yet within a few years the country was making decided progress relative to its nearest competitors in Europe. Moreover, it had not gone through a national trauma, although perhaps the experience of the 1970s came close to it.
From our study of these eight cases of economic transformation, 10 clear lessons emerge. We lay them out and then explain them below:
- Lesson 1: A strategy is needed, but not necessarily a plan.
- Lesson 2: Drop the search for a silver bullet: there needs to be a package of measures.
- Lesson 3: Fiscal prudence is usually a necessary but insufficient condition for transformation.
- Lesson 4: Low inflation helps, but on its own it is not decisive.
- Lesson 5: Tax can matter critically – not always, but often.
- Lesson 6: High rates of investment are usually critical: except temporarily, this requires high rates of national saving.
- Lesson 7: Competition is the key driver of efficiency: openness to international trade is a major element, but not the only one.
- Lesson 8: Once the basics of sound macro policy are in place, the reform agenda must be focused on a series of micro measures.
- Lesson 9: Leadership is crucial: but success requires more than just one key individual.
- Lesson 10: Early successes and a clear vision for the future are key to retaining political support.
Lesson 1: A strategy is needed, but not necessarily a plan.
In our eight case studies, there is a wide variety of approaches to planning. South Korea planned intensively, France did so indicatively, Singapore guided its development, Germany knew where it was going, but Hong Kong had no plan at all. Ironically, Mrs Thatcher had a financial plan which was supposed to give confidence to the markets but she had no plan for the real economy.
She did, though, have a clear strategy for economic policy, that is to say, a clear view of what needed to be done, and this had been thought through carefully by a group of leading figures in the Party while they were still in Opposition. The restoration of macro stability, reducing inflation and making fiscal policy sustainable, came first. Thereafter, the key elements of her reform package evolved naturally and the limits – e.g. no fundamental reform of the NHS – continued to be observed.
Even if there is no plan as such, there needs to be such a clear strategy because successful transformation of an economy requires that a consistent policy be sustained for a prolonged period. Otherwise, a government risks being blown hither and thither by the changing winds of politics. The temptation will always be to court easy, short-term popularity without addressing the country’s long-term, structural problems. Moreover, a clear strategy helps a government to retain political support through difficult times. (See Lesson 10 below.)
Lesson 2: Drop the search for a silver bullet: there needs to be a package of measures.
It has been a feature of British post-war policy-making that the economic establishment has tended to believe that there was a single underlying cause of our relatively poor economic performance and accordingly that there was a single “silver bullet” solution. At one point, joining the EU was widely thought to be the silver bullet. Ironically, decades later, some analysts and commentators believed that leaving the EU was the silver bullet. Incredibly, some now seem to believe that rejoining the EU offers a one-stop, radical solution to our troubles.
At various other times, a lower exchange rate or a change of exchange rate regime, or the conquest of inflation, have been believed to be silver bullets.
What does the international evidence suggest about silver bullets? For most of our fast-growing countries, the solution was not one measure or set of measures but several. Perhaps one clear exception to this pattern is Hong Kong, where the silver bullet was simply to allow the unfettered market to have free rein. But even here, this was accompanied by a tight fiscal policy which built up a substantial fund of investments for the government. (See Lesson 5 below.)
In all the other cases studied, rapid growth involved several different elements. This was even true of the Thatcher Revolution of the 1980s, once the government had brought inflation down and got over its monetarist obsession.
This makes perfect sense. When an economy has been malfunctioning for some time, its failings are likely to show up in a number of different areas. This also ties in with the analytical approach taken in this study, namely to examine several key areas where the British economy appears to be under-performing. We will identify those reforms that would make the greatest difference.
Lesson 3: Fiscal prudence is usually a necessary but insufficient condition for transformation.
Fiscal prudence has been a factor in the economic success of Hong Kong and Singapore. More strikingly, its opposite, fiscal imprudence, has been a significant factor in many countries’ failure. This was surely true of the UK’s experience in the 1970s when the dire state of the public finances contributed to an atmosphere of revolving crisis.
By contrast, by the mid-1980s, with the fiscal position much improved, UK fiscal policy contributed to a sense of greater stability. As it turned out, however, there was to be another bout of high inflation at the turn of the decade, and another period of fiscal stringency in the early to mid-1990s.
Fiscal policy can also be of key relevance for countries trying to deal with a tendency for consumers’ expenditure to leap ahead. Tighter fiscal policy helps to restrain inflation at lower rates of interest, thereby helping to keep the exchange rate competitive, and limiting the extent of any deterioration in the current account of the balance of payments. And it is highly relevant to the rate of national savings. (See Lesson 6 below.) Yet, putting the public finances on a sound footing is not enough, on its own, to transform an economy.
And, as so often, South Korea is in a different category. It is an example of a country that has transformed itself despite experiencing, in its early years of rapid development, pretty lax fiscal and monetary policies.
Quite apart from the question of public sector deficits, there is the matter of the share of government spending in GDP. There are examples of successful economies with quite different levels of government spending in relation to GDP, from Singapore’s 15% and Hong Kong’s 20% to France’s 40-50%. Yet clearly, as a matter of arithmetic, if a country is to have a low ratio of tax to GDP without a budget deficit, then it must have a correspondingly low ratio of government spending to GDP.
If a reforming British government seriously wanted to move the UK to a much lower rate of taxation, then it would have to have a plan for a substantial reduction in the share of government spending in GDP.
Lesson 4: Low inflation helps, but on its own it is not decisive.
In virtually all our cases, transformation occurred against the backdrop of low inflation. In the cases of Germany and France in the early years at least, this was partly a reflection of the global economic conditions of the time. But in Germany, throughout the period of transformation and beyond, there was an institutionalised hatred of inflation. After a while, as confidence in low inflation bedded in, the associated feeling of stability surely contributed to Germany’s economic success.
Under Mrs Thatcher, the UK turned its back on the rampant inflation of the 1970s but she did not manage to achieve lastingly low inflation in the UK. The strong economic revival in the second half of the 1980s saw inflation resurging.
The clear outlier is South Korea, which prospered despite experiencing rather high and quite volatile inflation.
But, as with fiscal prudence, although the establishment of low inflation can remove many inefficiencies that high inflation engenders, in and of itself it will not deliver economic transformation. High inflation is often a symptom rather than a cause of deep malaise.
What Mrs Thatcher achieved in improving British economic performance was not mainly down to lower inflation but rather to the series of micro reforms that she introduced which increased the tempo of competition and boosted efficiency. (See Lessons 7 and 8 below.)
Lesson 5: Tax can matter immensely – not always, but often.
Among our eight cases, there are three examples where tax has played a very major role in promoting economic success – Hong Kong, Singapore and Ireland. This is less clear in the other cases.
It is not even clear in the case of the UK in the 1980s. It proved devilishly difficult to reduce the average tax rate even under a leader like Mrs Thatcher who strongly believed in lower taxes. By the end of her tenure, the tax to GDP ratio was only some 4% of GDP lower than it had been when she took over. This was not enough to transform the UK into a low tax economy. Moreover, the tax-take quickly rebounded. It is difficult to see Thatcher’s reduction in the tax-take as a leading force behind the decided improvement in economic performance during the 1980s, continuing into the 1990s.
What mattered much more, though, was the restructuring of the tax system and, especially, the reduction, in two bites, in the top rate of income tax from 83% to 40%. This contributed to a transformation of incentives and a radical change in the business and social climate.
In Ireland the establishment of an ultra-low rate of corporation tax has transformed the country’s attractiveness for multinational businesses, which has been a key factor behind its success.
In two of the countries examined – Singapore and Hong Kong – quite apart from the low level of taxation, the simplicity and stability of the tax system has been a key feature. This has allowed businesses and households to plan with some confidence that tax changes would not scupper the advantages of undertaking a particular course of action.
In contrast to nearly all other governments which have to pay out a significant part of their tax revenues in debt interest, the Hong Kong and Singapore governments receive a very large sum each year from their investments. For any given level of government expenditure, this extra source of revenue allows them to operate with lower rates of tax.
The fact that two of our countries, Germany and France, managed to achieve high rates of growth in their transformation years without operating with ultra-low tax rates is potentially misleading. In both cases, two overwhelming factors at work in effecting a transformation were recovery from the war and the transfer of labour from low productivity employment in agriculture and services. As long as the tax system was not completely dysfunctional, these structural factors were going to lead to rapid growth, even if tax rates were relatively high.
Moreover, although France has a reputation as a country of high public spending and high tax rates, these features were nothing like as prominent during France’s years of rapid economic growth. Rather, government spending started to rise markedly as a share of GDP from the 1970s onwards, after France’s “thirty glorious years”.
It is noteworthy that in recent decades, when the benefits of post-war recovery and labour transfer were exhausted, the growth rate of both economies has slowed markedly. Admittedly, even the low tax economies of Singapore and Hong Kong have also slowed but they continued to grow faster than most developed economies and continued to show marked economic dynamism.
Lesson 6: High rates of investment are usually critical: except temporarily, this requires high rates of national saving.
In all our examples, economic transformation was accompanied by, and partly facilitated by, strong investment, certainly by the private sector and often by the public sector as well. The British case under Mrs Thatcher appears to be an exception but, by British standards at least, investment was strong during the peak Thatcher years.
Of course, the quality of investment matters a great deal as well as the quantity. Wasteful investment amounts simply to consumption – but without the enjoyment. In the UK we have a history of making some poor public sector investment decisions, or not making them at all, as with Heathrow’s third runway. All other countries in this study seem to do a better job of this.
In the private sector, to a considerable extent, success breeds success. Private investment would be stimulated by businesses having confidence that government policy would be stable and directed at the long term. This would sharpen the private sector’s appetite for risk and encourage it to think and act long-term.
How a higher rate of investment links with a country’s savings behaviour does not receive the attention that it deserves. If a country is to enjoy strong investment then, unless it borrows extensively from abroad, which brings its own problems, it has to find domestic sources of finance. It is notable that in East Asia, private sector savings rates have been high, enabling high rates of investment to be financed domestically. Indeed, saving has been so strong that these countries have all run significant current account surpluses, that is it say, they have been exporting savings abroad. Within Europe this is also strikingly the case with Germany.
By contrast, the UK has a problem with an endemically low rate of personal savings, combined with a low rate of investment. If the latter is to be increased, surely a requirement for a much better growth performance then, unless the current account deficit is to widen further (which would be a decidedly bad idea), then the UK must make room for this investment by constraining public expenditure and/or private consumption. Potentially, both of these are unpopular but restraining private consumption is probably more so. The way to minimise the extent to which a consumption squeeze is necessary lies in containing public non-investment spending.
Lesson 7: Competition is the key driver of efficiency: openness to international trade is a major element, but not the only one.
In nearly all our cases, the growth of international trade has been a feature of their experience and a major contributor to their success .
Yet again, South Korea is a case on its own. It developed behind a tariff wall designed to shelter and develop so-called “ infant industries”. Even here, though, protected companies were driven to export and there was intense competition between different Korean companies. The weakest went to the wall.
In most of our cases, success in export markets has been a key feature. This is true of Germany, Singapore and Hong Kong. In all these countries, the current account of the balance of payments was in surplus. This was not true for South Korea up to 1976, but it was true afterwards.
For most countries, heavy involvement in international trade has been a key driver of efficiency. Not only does it enlarge the size of the market for domestic producers, thereby enhancing the scope for economies of scale, but it also increases competition in domestic markets. In fact, it acts as a sort of Competition Policy.
For Poland, however, the main factor making for increased efficiency was the switch from public to private ownership as a result of the privatisation drive – which had also featured prominently in the factors making for increased efficiency in the UK under Mrs Thatcher.
For the UK now, the fact that this privatisation drive is long behind us, plus the UK’s already heavy exposure to international trade, argue in favour of the idea that the UK economy is pretty competitive internally. However, that is not necessarily true of all parts of the service sector. Moreover, compared to the rapidly growing countries of Hong Kong and Singapore, the UK has a large public sector where there are next to no competitive pressures.
The UK is the world’s second largest exporter of services. But she could be even more successful in this sphere. The success of Hong Kong and Singapore pleads the case for low taxes but other features of a country’s domestic economy are also important to make it attractive for international businesses to locate there, to retain key personnel and to make its services compete effectively in world markets.
These include factors such as the efficiency of the transport system, the effectiveness of public administration, the cost effectiveness of regulatory systems, the good functioning of the housing market, low crime and many more. In many cases, for a country like the UK, the key to achieving improvements lies with making markets work better, or even in introducing markets where none currently exist. (See Lesson 8 below.)
Lesson 8: Once the basics of sound macro policy are in place, the reform agenda must be focused on a series of micro measures.
In some of our cases, there was a considerable contribution from good, conservative, macro policy-making. But this was not true of South Korea and, strikingly, it wasn’t entirely true of Mrs Thatcher’s Britain.
Of course, gross errors of macro policy can scupper an economy. But, starting from where we are, it is unlikely that tweaks to the macro policy regime – changes to the inflation target or the fiscal rules, for instance – can deliver the keys to economic success.
In all our cases, including Mrs Thatcher’s Britain, the major contribution to promoting economic growth was made by good micro policy-making. This points the way for the UK today. In contemplating the way forward, a reforming UK government would need to get into the weeds of the British economy, into the detailed workings of its under-performing sectors. This may include, as far as its actions are concerned, getting out of those workings. In many cases, government intervention is part of the problem, not the solution. At the very least, government interventions, including regulatory regimes, must be reviewed in relation to their effect on economic performance. But there are other cases, such as road pricing, where a proper market does not currently exist and where it could only come into being as the result of government action.
Lesson 9: Leadership is crucial: but success requires more than the contribution of one key individual.
In all but one of the cases studied, economic transformation enjoyed strong leadership from the top, with one key individual driving things forward: Mrs Thatcher in the UK, Jean Monnet in France, Ludwig Erhard in Germany, Lee Kwan Yew in Singapore, Sir John Cowperthwaite in Hong Kong, General Park in South Korea and, arguably, Leszek Balcerowicz in Poland. Only Ireland lacked an outstanding figure without whom the growth push probably wouldn’t have happened.
But this does not amount to a case for the UK to set off in search of a transformational leader. This would be the search for a silver bullet in human form. In any case, transformational leaders cannot really be searched for: they just appear. More positively, in all our eight cases, there was a cadre of politicians and officials who shared a common goal. This was even true in the case of Mrs Thatcher.
It is especially noteworthy that in some key examples, the quality of the civil service was critical. This was true of Singapore and, strikingly, it was also true of free-wheeling, pure capitalist Hong Kong. One of the key advantages enjoyed by France in the post-war period has been the technical expertise of its senior civil servants who have been able to make key decisions effectively and to co-operate with business leaders in pursuit of economic success.
If the UK is successfully to pursue a programme of economic reform it will probably require a fundamental restructuring and reform of the civil service.
Lesson 10: Early successes and a clear vision for the future are key to retaining political support.
Mrs Thatcher’s position was unique. She won power in 1979 but initially she was in a precarious position politically. She won two stunning election victories in 1983 and 1987 against weak and divided opposition. This enabled her to push through and sustain radical and unpopular policies. But even she was ultimately vulnerable and she was deposed in 1990. So she had only 11 years as Prime Minister. 11 years is, by British standards, a very long period in power but this is short compared to the periods over which our three strong Asian leaders effected their economic transformations. And out of her 11 years in power, she enjoyed political dominance for only 6 years (from 1983 to 1989).
Our three Asian examples all benefitted from having powerful leaders who were not constrained by all the usual factors that apply in democratic systems. This wasn’t the case for France and Germany but at least they had the recent experience of the war to act as a spur and unifying force. And Poland had the spur of the adjustment from communism to a market economy and the escape from the Russian sphere of influence. It also had the lure of future EU membership to bind society together.
How could a country like the UK muster and sustain the political support necessary to persevere with an extended programme of radical reform? After all, it would be impossible to prevent some people from being short-term losers from the programme.
It would be important to try to ensure that the gains from economic improvement were widely distributed. Where there are major losers from a reform programme, effective compensation can help to sustain support. A carefully constructed programme of tax reductions could also help to retain support, as could the wider spread of property ownership.
Over and above this, in our view, it is important that, as reform progresses, there are some early successes in order to retain confidence and sustain political support. In addition, it is important that there should be a clearly articulated vision for future measures and a shared understanding of how these are going to deliver economic benefits for everyone.
Getting through the political barriers
Even so, and even If it were clear what needed to be done to radically improve economic performance, the political barriers against achieving something meaningful are huge. How could they be overcome? In a democracy like the UK, there are four possible routes:
- A coalition government is formed by the major political parties, pursuing a policy of national economic resurgence.
- One political party achieves such dominance that it is able to develop policies for the long-term and to sustain them across an extended period.
- A consensus develops across the main political parties to such an extent that if one party takes over from another in government, much the same reform policies are pursued.
- One political party, on winning power, sets out with a phased programme of reforms. Early successes on the first stages build support for further changes and so radical reform proceeds in a step-by-step manner.
The first of these, a coalition government dedicated to economic reform, does not look like a realistic prospect. In the British system, coalition government does not come easily. True, the wartime coalition is generally reckoned to have done a good job but those were exceptional circumstances of great national peril amidst general agreement about what needed to be done, namely to defeat Germany. Even then, the coalition only lasted for 5 years and once the war was over, normal politics resumed straightaway.
The Coalition Government of 2010-15 did a reasonable job, although it was no radical reformer of the UK economy. Anyway, it only lasted for five years. Serious reform of the UK economy is a project for at least 10 years, and more like 20.
The second route, namely political dominance by one party seems more feasible but it is not at all clear that any of the UK’s political parties could achieve such dominance, and sustain it, let alone knowing what to do with its power anyway, unless it is by adopting the fourth approach, as discussed below.
Similarly, the third route, whatever its attractions, does not seem within reach in current circumstances. But perhaps it could be within reach through a merger with the fourth route, that is to say, if a government started to deliver economic success, bit by bit, then either it might become dominant in government for a sustained period or the opposition parties could adopt its approach so that whoever was in power did not matter very much, rather in the way that happened after Mrs Thatcher’s fall from power in the UK.
So, the best hope for getting a sustained economic revival in the UK rests with the pursuit of a reform agenda, proceeding bit by bit, and delivering successful outcomes along the way in the context of a clear strategy for economic reform. This would then help to build confidence and support for further measures in such a way that an early reversal of the reform strategy was not politically attractive, whoever was in power.
Policy Exchange’s Policy Programme for Prosperity aims to lay out just such an agenda for reform.
Next chapterI Mrs Thatcher’s Britain – Turning the Country Round: 1983-2007.
The dates of Mrs Thatcher’s period as Prime Minister are a matter of history – 1979 to 1990. Yet the dates of the transformation of the UK through her policies are a matter of conjecture and dispute. Her reform programme began straightaway upon taking office, but the immediate macro performance of the economy was dire. It wasn’t until after her second election victory in 1983 that things started to look a lot better and not until after the third victory in 1987 that the economy was really motoring. It was then that people spoke of the Thatcher Revolution.
And establishing the end date is also difficult. It is probably best to date the period of transformation according to the rate of growth of per capita GDP relative to the rest of the EU and other leading developed countries. On this measure, the UK started to outperform a few years into Mrs Thatcher’s period in office and, with a slip at the beginning of the 1990s, this continued under Prime Ministers Major and Blair. But it came to an abrupt halt in 2007/9 with the onset of the GFC.
The strategy for transformation
During the Conservatives’ period of Opposition in the late 1970s, Mrs Thatcher developed a clear set of principles on which the economic strategy would be based. The strategy was hammered out by a set of close associates and was accepted by her inner circle.
This was pretty unusual. In his much referenced paper known as the “Stepping Stones Report”, one of her senior advisers, Sir John Hoskyns, wrote: “Strategy can be defined, for political purposes, as “ the careful thinking we wish we had done two years ago, but don’t have time to do today”.1Available from the Thatcher Archive at Cambridge University, p 3. But Mrs Thatcher’s government was different. It did have a strategy. Senior figures, including Mrs Thatcher herself, had done the thinking.
It is difficult to over-estimate the power and authority of Mrs Thatcher in her pomp. And it is difficult to believe that anything quite like the Thatcher Revolution could have happened without her. Yet, for all that, this was no one woman band. The Thatcher Revolution was the work of several key people, including especially her chancellors, Sir Geoffrey Howe and Nigel Lawson, and also Norman Tebbit, Sir Keith Joseph and Cecil Parkinson.
Although there were differences of opinion on some issues, such as mortgage interest tax relief, attitudes to the EU and the Poll Tax, there was a strong cadre of ministers who were united behind the Thatcher reform agenda.
The primary intellectual driver was Sir Keith Joseph and, through him, the strongest intellectual influence was Friedrich Hayek. In essence, Mrs Thatcher and her acolytes believed that the UK had been weakened by its lurch towards collectivism in the post-war period. This began under a Labour Government immediately after the war, but it was largely endorsed by, and continued under, Conservative governments.
Accordingly, breaking away from this approach entailed conflict, not only with the Labour Party but also with much of Mrs Thatcher’s own Conservative Party as well. Indeed, throughout the first few years, a considerable number of Conservative MPs, as well as many Cabinet ministers, wanted to oust her and to stage a complete about-turn in economic policy.
And you can understand why. Her economic policy was deeply unpopular in the country. That was partly because many saw it as unjust and uncaring but also it was because for a long time it did not seem to be working. The policy was supposed to reduce inflation but in the first months inflation rose, as Chart 1 shows, thanks to a combination of the rise in global oil prices, the increase in wages in the wake of the Clegg Commission’s Report on public sector pay and the effects of the near-doubling of VAT in the Conservatives’ first budget.
Moreover, the variable on which the whole strategy of inflation reduction was pinned, namely the measure of the broad money supply known as Sterling M3, continued to expand rapidly, despite interest rates being increased in 1979 in two stages from 12% to 17%, in an attempt to reduce the rate of monetary growth. (See Chart 2.) Unsurprisingly, the effects on the housing market and on many individual home-owners were severe.
And the effects on the real economy were devastating. As Chart 3 shows, unemployment continued to climb throughout the first 5 years, reaching a post-war record of nearly 12% in 1984, compared to 5.5% when the Conservatives took office in 1979. The nightly television news, then regularly watched by millions of families across the country, was dominated by stories about factories closing and businesses contracting or going bust. The aggregate GDP statistics showed a peak to trough decline in output of more than 5%, making this the then deepest recession since the 1940s.
The effects were very unevenly distributed across the country. Many parts of the Midlands and the North were devastated by the closure of businesses on which entire communities depended.
Meanwhile, most of the economic establishment was against these policies – and that included senior figures in the Treasury and the Bank of England. In response to the fiscally contractionary budget of 1981, a letter was sent to The Times newspaper, complaining about these policies, signed by no less than 364 economists (not including the authors of this study). Ironically, it was just about at this point that the economy started to recover.
And much of big business was opposed to the Government as well. In November 1980, Sir Terence Beckett, the head of the employers’ organisation, the CBI, who in those days would normally have been expected to be supportive of a Conservative administration, promised “a bare-knuckle fight” with the Government.
Politically, the Government was helped by the fact that the opposition Labour Party was weak and poorly led. And it then had the apparent good fortune of seeing the Labour movement split as the breakaway Social Democratic Party (SDP) was formed in 1981. But even this was of limited help because this new party soon soared to a commanding position in the polls. It attracted not only disillusioned Labour Party supporters but also many disillusioned Conservatives as well. For a time, it seemed that in a general election the SDP was going to win a majority of seats in parliament.
Given the scale of the opposition to her government and its policies, therefore, in her first few years, Mrs Thatcher’s freedom of manoeuvre was extremely limited. It was only after the victory over Argentina in the Falklands War of 1982, and her stunning victory over Labour in the general election of 1983, that her political position was secure and she had a more or less free hand to push strongly ahead. Her position was further consolidated by the victory in the miners’ dispute of 1984/5 and the subsequent general election victory of 1987.
Yet not long after this victory, opposition to Mrs Thatcher and her policies began to intensify. This was partly because they were widely seen as harsh and her style as dictatorial and insensitive, but also partly because of her anti-Europeanism. But the real killer was her strong belief in the Community Charge, which was widely referred to as “the Poll Tax”. This eventually undermined her support so much that she was effectively forced to resign in November 1990.
Meanwhile, inflation had risen alarmingly and interest rates had to be raised to 15% to try to rein it in. Moreover, just before she left office, Mrs Thatcher was forced to accede to the UK joining the European Exchange Rate Mechanism (ERM), the antecedent of the euro, in October 1990. For the succeeding two years, the economy was devastated, inflation was still high, interest rates were in double figures until May 1992, house prices were falling and unemployment was rising.
At this point you could have been forgiven for believing that the “Thatcher Revolution” was over, if it had ever been more than a mirage in the first place. Yet, as we show below, the effects of the Thatcher reforms could be seen in the UK’s economic performance for almost twenty years after her departure from office.
The Policy Programme
Mrs Thatcher and her close advisers and colleagues had the ambition of halting and reversing Britain’s relative economic decline. To achieve this, they focussed on eight key objectives which they saw as critical to improving economic performance:
- Reducing inflation;
- Weakening the trade unions, thereby reducing their ability to disrupt businesses and getting them out of their close and privileged position in government;
- Reducing public borrowing and reducing the weight of public debt;
- Reducing the size of the state and its role in the economy, including eschewing state support for both ailing firms and industries and potential successes (“picking winners”) 2In the event, the policy of abandoning all state support was not always rigidly adhered to. See Sir Geoffrey Owen’s paper “Where Now For UK Industrial Policy”, Policy Exchange, London, 2024. ;
- Reducing the average rate of tax and reforming the structure of tax so as to minimise distortions and boost incentives to work, save and invest;
- Privatising the large parts of British industry that were in state ownership;
- Increasing competition;
- Attracting Foreign Direct investment (FDI).
The priority attached to these objectives and the intensity with which they were pursued changed over the years that Mrs Thatcher was in office but none of these objectives was abandoned, or even appreciably watered down. To that extent, therefore, there was a consistency of vision across the period.
Sequencing
Mrs Thatcher and her inner circle had a clear idea about sequencing. First and foremost, they wanted to bring the inflation rate down, which they did, albeit there was some slippage at the end of the 1980s, as Chart 1 shows.
Although they desperately wanted to reduce the general rate of tax, they believed that it was first imperative to bring the public finances under control. This meant a tightening of fiscal policy which initially involved an increase in the tax-take as a share of GDP. Indeed, the share did not start to fall until 1982/3. (See Chart 4.) Similarly, as Chart 5 shows, the share of government spending in GDP initially rose. (We comment on fiscal policy in more detail later.)
Interestingly, although the privatisation of state-owned businesses was begun with the privatisation of BP in 1981, it was not initially a top priority. (This is not true of the sale of council-owned houses to their existing tenants, which was a key objective early on.) Privatisation did not figure in the 1979 manifesto and hardly figured in the manifesto for the 1983 election. Its beneficial effects on economic performance were largely stumbled upon. Privatisation was first envisaged primarily as a way of raising money for the Government and thereby reducing the size of its borrowing requirement.
In the event, largely because of the privatisation programme, employment in state-owned corporations fell from 8 million to 3 million and their contribution to GDP fell from 10% to less than 5%.3Russell Jones, The Tyranny of Nostalgia, London, 2023, p 83.
This not only had a beneficial effect on efficiency but it dramatically reduced the percentage of the workforce that was unionised and radically reduced the share of the economy taken up by enterprises whose ultimate paymaster was the state.
The Thatcher government was acutely aware of its potential weakness in relation to the miners’ union, the NUM. It had played a key role in bringing down the Conservative government led by Edward Heath in 1974 and it continued to exercise a strong hold over the Labour Party. Strange as it is now to imagine, but in those days dependence on coal was seen as critical.
One of the smartest things that the Thatcher government did was not to take on the miners early on and instead to concede to their demands and then to use the breathing space to build up coal stocks at the power stations. This meant that when the miners went on strike in 1984, the power stations had enough coal to continue producing power for many months, while the strikers had to carry on under increasingly difficult conditions. They eventually wilted.
Another key element of the Government’s approach to sequencing was the absence of major reform of the NHS. Not that Mrs Thatcher and her ministers were under any illusions about the failings of this service and the strains that these were placing on the public finances and overall economic performance. They merely judged that the NHS figured too large in the nation’s affections and that most voters would be fearful of any attempts radically to reform it. Across the Thatcher years, the share of NHS spending in overall government spending rose slightly and its share in GDP was broadly stable.
There were various reforms to the welfare system but there was no fundamental weakening of the welfare state. In 1990, the share of welfare spending in total government spending was broadly the same as it had been in 1980.
Similarly, there was no major reform of the education system, nor any weakening of the power of the teachers’ unions.
The economic facts
How successful was the Thatcher programme? When you look at the bare figures for the growth of GDP per capita, there is no sign of a transformation in the UK’s economic performance, as Tables 1 and 2 make clear. In the period from 1979 to 1990, the average annual increase in GDP per capita was 2.4%. This was well below the 2.8% recorded in the 1950s and ‘60s. It was even below the 2.9% recorded over the supposedly disastrous 1970s. (Mind you, this decade average is flattered by strong growth in the early years. The figure for the disturbed period 1973-1979 was much lower.)
This makes a marked contrast with most of the other countries in this eight country study. For these others, some spectacular growth figures were registered in the period of transformation. In the UK’s case, it is only in comparison with other countries that the achievement of the Thatcher government becomes apparent. Whereas before the Thatcher years, GDP per capita was growing much more slowly in the UK than in France, Germany and the US, during the Thatcher years its growth was above the equivalent in France and the US, and even marginally above Germany. (See Table 2.)
The change in the UK’s relative performance was even starker in relation to manufacturing where, in the years 1979 to 1995, labour productivity per hour worked rose much faster than in France and Germany. By contrast, in the two decades before then, it had increased by much less. (See Table 3.)
On many of the subsidiary indicators of economic success and wellbeing, there were also real signs of progress. Although the UK’s share of international trade did not pick up, the previous steep decline was at least arrested. (See Chart 6.)
The working population increased significantly, both absolutely and as a share of the total population, although both have subsequently risen far higher. (See Charts 7 & 8.) Nevertheless, unemployment remained high even after the strong economic recovery of the mid to late 1980s. (See Chart 3.)
By the end of Mrs Thatcher’s tenure, fixed investment (GFCF) was running at close to a post-war high of almost 25% of GDP, but in the subsequent post-Thatcher period under premiers Major and Blair, it fell back sharply to levels below where it had been in the 1970s. (See Chart 9.)
Inflation was reduced but it never reached the low levels that became normal later and by the end of the Thatcher years it was rising again. In the later stages of the Thatcher/Lawson boom, the economy was in the throes of a strong, cyclical expansion. CPI inflation peaked at over 8% in October 1990.
The average inflation rate for the Thatcher years, at 8% on the RPI and 6.8% on the CPI, was not spectacularly low. Mrs Thatcher managed to overcome many of the inflationary forces of the 1970s but really low inflation, i.e. about 2%, only came about under a Labour Government. (Refer back to Chart 1.)
After initially rising in 1979-81, the ratio of tax receipts to GDP subsequently fell. But the scale of the achievements in this regard was distinctly limited. By the time that Mrs Thatcher left office in 1990, the ratio of government revenue (mainly tax receipts) to GDP was standing at 34%, compared to 38% when she took office. 4This refers to the OBR’s “Public Sector Current Receipts” definition. On another OBR definition, “National Account taxes”, the figures are slightly lower but the overall picture is very similar. (See Chart 4.) This was a meaningful drop but it did not transform Britain into a low tax country. And subsequently, after falling a bit further, the ratio settled at 37%, before the recent rise to above 40%.
These limited reductions in the tax burden mirrored developments with regard to government spending. Chart 5 shows the share of government spending in GDP on the Total Managed Expenditure definition. It fell from a peak of 43.2% in 1982/3 to 34.6% in 1988/9. On the chart, this reduction looks pretty impressive but that is because the vertical axis, against which expenditure is measured, does not start at zero. Moreover, the readings at the end of the 1980s were distorted by the fact that the economy was roaring away at this point. In any case, just before the GFC began in 2007, the share of government spending in GDP was back to 40%.
The budget deficit was brought down and indeed the budget was briefly in surplus at the end of the 1980s. But the budget balance quickly turned into a large deficit with the onset of recession. (See Chart 10.) The ratio of government debt to GDP also fell significantly, before rising pretty much continuously after 1990. (See Chart 11.)
Four other key features of economic performance over the Thatcher years need to be noted. The first is the relentless fall in the share of GDP accounted for by manufacturing. This fell from about 23% in 1979 to about 19% in 1990. It has subsequently fallen further to about 9%. (See Chart 12.)
This sharp fall was significant for several reasons, including the regional imbalance of the economy, but especially because of its effects on the possibilities for productivity growth. In nearly all economies, productivity grows faster in manufacturing than in other sectors.
Mind you, the declining importance of manufacturing was far from being a uniquely British phenomenon. France experienced a similar decline. Germany is the major outlier here. Even there, the share of GDP accounted for by manufacturing has fallen considerably but it remains far higher than the equivalent in the UK and France.
The second key feature is the dominance of consumers’ expenditure in the boom of the late 1980s, with much of it debt-financed and associated with a sharp fall in the personal savings ratio.
The third is connected with this - the weakness of the current account of the balance of payments. After an initial spike caused by North Sea oil revenues – and government receipts from the North Sea reached a peak of 3% of GDP in 1984/5 - the current account balance deteriorated to a deficit of about 4% of GDP in 1989. (See Chart 13.)
The fourth feature is that, despite several redefinitions aimed at disguising its true extent, unemployment remained high throughout the Thatcher years. As Russell Jones puts it: “ However it was measured, the jobless rate was higher in its best year in the 1980s than it was during its worst year of the 1970s.”5Jones, The Tyranny of Nostalgia, p 59.
Success in the political after-life
1990 and 1991 may have been difficult years for the economy but after the UK left the ERM in September 1992, economic performance revived. For the years 1991 to 1997, the UK’s average annual growth rate of GDP per capita was 1.8%, again nothing spectacular but higher than the rate in France Germany and the US. (See Table 2.)
Admittedly, this growth performance was boosted by the benefit of the lower exchange rate made possible by the ERM exit, but this does not undermine the point abut supply side performance. After all, the point is that the economy was able to benefit from the lower exchange rate rather than losing all of its initial benefits in a burst of inflation, as has happened on some other occasions.
Moreover, the improved economic performance continued under the following Labour Government which largely accepted the Thatcher settlement on trade union laws, privatisation, fiscal policy and taxation. Indeed, this “New Labour” Government saw the fulfilment of Mrs Thatcher’s reforms. During the period from 1998, the year after Labour took power, to 2007, the onset of the GFC, GDP per capita grew at an average rate of about 2.2% per annum, faster than the rates in France, Germany, Italy, Japan and the United States. (See Table 2.)
Nor can this performance be explained by changes in workforce participation, as Table 4 makes clear. The UK’s relative performance was similarly good when measured on output per employed person. And on the growth rate of GDP per hour worked, shown in Tables 5 and 6, the UK also generally did well until 2007. (Table 5 shows the growth of real GDP per hour worked, broken down into decade averages, whereas Chart 6 shows the same data but broken into sub-periods that align with political changes and the onset of the financial crisis in 2007.)
The distinguished economic historian, the late Professor Nick Crafts, noted that by 2007, the UK had a slightly higher GDP per capita than either France or the former West Germany. Admittedly, labour productivity per hour worked was still lower in the UK. But it made up for this through longer working hours and higher rates of employment. These factors were themselves very much the result of the reforms of the Thatcher period.6Nicholas Crafts, “The Economic Legacy of Mrs Thatcher”, Voxeu, 8 April 2013.
It looked as though the UK had indeed turned a corner and was now gaining ground against other leading countries. Unfortunately, as Tables 2, 4 and 6 make clear, the UK’s outperformance came to an end with the GFC. After that, the UK’s growth in per capita GDP fell back to only 0.5%, the same as France, but well below the rates recorded in Germany and the US.
An overall assessment
What are we to make of the Thatcher years? Was there a real economic transformation? The first couple of years of the Thatcher period were a macroeconomic disaster. Many apologists will say that imposing such pain on the economy was the only way of bringing about the transformation that Mrs Thatcher desired and the country needed.
They may be correct that the economy needed some strong medicine but we are sceptical that the type and intensity of the treatment were well-chosen. And the medicine very nearly killed the patient. It is striking and surely telling that the policy on inflation reduction was based on a critical misunderstanding. Key ministers, including the chancellor and Mrs Thatcher herself, believed that controlling the money supply would bring inflation down ineluctably – and perhaps painlessly. A Medium-Term Financial Strategy was constructed, laying down target rates of increase of the money supply and levels of public borrowing in the years ahead.
In the event, inflation fell despite the money supply continuing to grow rapidly. It was economic recession and unemployment, brought on by high interest rates and the associated strong pound, that brought inflation down in time-honoured fashion. In subsequent years, red claw monetarism was gradually (and quietly) abandoned.
In the disinflationary process, the exchange rate of the pound played a key role. It was allowed, and even encouraged, to soar to extreme heights. During the two years after the first quarter of 1979, the pound rose by about 25%. Meanwhile, the UK’s domestic labour costs were rising about twice as fast as the equivalent in our competitors. This had devastating effects on the competitiveness of British industry and was itself responsible for a large part of the deindustrialisation that followed.
Apologists might say that the strong pound was not only due to Mrs Thatcher’s monetary policies but also to the advent of North Sea Oil. For a time, sterling was seen as a petro-currency. This is true but this does not really exonerate the government because surely what it should have done was to have used the revenues from North Sea Oil to build up overseas assets by selling sterling on the exchanges. This would have moderated the strength of the pound and provided a useful rainy day fund. As a share of GDP, gross oil production rose from zero in 1974 to 2.7% in 1979, the year Mrs Thatcher took power, and 7.4% by 1984.7C. Bean, “The Impact of North Sea oil” in Rudiger Dornbusch & Richard Layard, The Performance of the British Economy, Oxford, 1987.
Instead, the revenues from oil taxes disappeared into the general public finances and, because of the adverse macroeconomic effects of the strong pound and tight policy, much of the benefit was lost in the need to pay increased amounts in unemployment benefits. (There is a marked contrast here with Norway, which used its North Sea revenues to build up a huge sovereign wealth fund.)
We believe that the government’s macro policy in the early Thatcher years was a mistake. Yes, without it, the inflation rate would have come down more slowly but equally, more of Britain’s industrial base would have been saved. The process of weeding out inefficient firms and practices did not have to take place at a speed and intensity dictated by the balance of opinion among international portfolio holders on the desirability of holding sterling.
Perhaps the clearest evidence that this policy was bizarre is the fact that within ten years the Treasury was attempting to steer the economy by reference to the exchange rate, firstly by surreptitiously shadowing the Deutschmark, and then by openly joining the ERM. It is difficult to believe that both the earlier complete indifference to the exchange rate and the later obsession with it were right.
Moreover, this macro policy almost destroyed the whole Thatcher experiment. As argued here, the transformatory effects of Thatcherism on the economy derived from various micro reforms which only began in earnest in 1983. Yet pushing through these reforms and being able to sustain them in a democratic country like the UK in the end depended to a considerable degree upon an accident of history.
Despite the very weak leadership of the Labour Party, without the Falklands victory, the Conservatives might well have lost the 1983 election. In that case, whether under a Labour Government or the SDP, or some coalition, economic policy would surely have been different. The legacy of Mrs Thatcher would have been a devastated economy with next to no reform accomplished.
Admittedly, some good judges believe that this exaggerates the importance of the Falklands victory and contend that the Government’s popularity was starting to recover before the war. Yet, even if the Conservatives would have been able to win an election without the Falklands factor, their majority would surely have been nowhere near as large as the one which actually materialised in 1983, and it would have been more difficult for Mrs Thatcher to be as radical as she turned out to be.
Interestingly, macro policy also went off the rails at the end of Mrs Thatcher’s tenure, with the economy roaring away and inflation rising, setting up the need for much tighter policy which duly sent the economy into another serious recession. So these Conservative governments led by Mrs Thatcher presided over two serious recessions in the space of not much more than a decade, both associated with gross errors of macro/monetary policy.
There were two other major areas of failure, this time in the micro sphere. First, the Thatcher government presided over, and arguably worsened, serious distortions in the housing market. It is paradoxical that whereas millions of British home-owners have regarded the housing market as a wonderful feature of the economy and the bedrock of their own financial security, in regard to its effects on the economy, in fact it has been a serious failure. 8For an excoriating assessment of this failing see John Muellbauer and David Soskice, “The Thatcher Legacy: lessons for the future of the UK economy”, The Resolution Foundation and the LSE, November 2022.
Second, for all the benefits that it brought, as noted below, the rapid growth of the financial services sector unbalanced the economy and laid the groundwork for the UK’s acute vulnerability in the global financial crisis of 2007/9, from which the country has never fully recovered.
Yet there were some highly positive things about the Thatcher governments, mainly in the micro sphere:
- Astonishing boldness, with the chancellor, Sir Geoffrey Howe, in his first budget, cutting the top rate of tax from 83% to 60%, increasing VAT from 8% to 15% and abolishing exchange controls;
- More radical tax cuts, tax reform and simplification of the tax system under chancellor Lawson;
- Resilience and determination, with the course of policy adhered to despite widespread and intense opposition and in the face of weak economic performance;
- Fundamental changes in labour relations with huge reductions in union power and a large drop in the number of days lost to strikes;
- A fundamental re-structuring of the ownership of the economy through the privatisation programme that transformed the post-war settlement;
- An intensification of competition which pressurised management into improving performance9See Nicholas Crafts “British Relative Economic Decline Revisited: The Role of Competition”, Explorations in Economic History, Volume 49, 2012.;
- Huge inflows of FDI which strengthened UK economic performance;
- The stimulation of entrepreneurship and venture capital which gave a spur to the development of new industries such as biotech;
- The revival of the City of London to the point where it became the largest international financial centre in the world for the first time since 1914.
Answers to the key questions
In the introduction to this study, we posed several key questions, the answers to which we hoped to find in our investigations. For the UK in the Thatcher period, these are our answers:
Was there a plan?
There was no pre-envisaged plan as such for economic revival but there was a vision and a strategy. The conquest of inflation and the stabilisation of the public finances came first. Interestingly, there was an explicit plan for this in the shape of the Medium-Term Financial Strategy (MTFS) which laid down target rates of growth of the money supply and for the level of public borrowing.
There was no explicit strategy for tax rates but the ambition was clearly to bring the overall rate of taxation down, to eradicate high marginal rates and to simplify the system. These changes were themselves supposed to bring increased efficiency Over and above the effect of these changes, the hope for growth rested on a reduction in trade union power, privatisation and an intensification of competition, as with the “Big Bang” in the City in 1986.
How long did it take for improvement to be clear?
A radical improvement in the UK economy was not evident for a few years after the reform programme began. Inflation initially rose, peaking in Q2 1980 about a year after Mrs Thatcher’s election victory in 1979, although by 1981 it had fallen back considerably. The economy started to recover in Q2 1981, But the perception that there was a “revolution” in economic performance did not gain hold until after 1983. The “Lawson boom” occurred after the 1988 budget. Unemployment continued to rise well after the economic recovery began. It peaked at 11.9% in Q2 1984, about five years after Mrs Thatcher’s election victory in 1979. Thereafter it fell rapidly but it was still extremely high when Mrs Thatcher left office.
Were there losers? And how was support for reform sustained?
Mrs Thatcher’s economic reforms created many losers. Prime among them were all those who lost their jobs, especially in manufacturing in the recession of 1979-81 and in the restructuring and the wave of privatisations that followed. Moreover, because of the concentration of manufacturing in particular areas, many towns, cities and regions were effectively losers from the Thatcher programme.
Mrs Thatcher nevertheless retained adequate support because she carefully and gradually sidelined major figures within her own party who opposed her policy and because the external political opposition was weak and divided. There was also a reservoir of support from the widespread feeling that things could not go on as they had been in the 1970s and that change was bound to be painful. Success in the Falklands War of 1982 undoubtedly helped and may well have been vital. Soon after that victory, the clear signs of economic improvement helped to strengthen her position.
Did the transformation involve a radical restructuring?
The Thatcher transformation most certainly did occur through a radical restructuring of the economy, most notably through the privatisation programme. But the improvements to be expected from weaker unions, lower inflation, lower and better structured taxes and a more competitive regime affected just about all parts of the economy and therefore some improvement could be expected even in activities and sectors that were not restructured.
Was there a sequencing of reforms and was this ideal?
The radicalism of the Thatcher government started straightaway but there wasn’t an attempt to do everything at once. It was probably correct to put the conquest of inflation and the stabilisation of the public finances first. And it was surely correct to delay some of the more radical measures until after support for the government had strengthened, as it did after 1982.
Did the transformation involve much higher savings ratios by households and/or the whole economy?
The Thatcher transformation did not occur as the result of a radically higher savings and/or squeezed consumption. The personal savings ratio remained low throughout the period. Moreover, an improved fiscal position was not enough to stop a radical deterioration in the current account of the balance of payments.
Was the transformation the work of one key person?
It is impossible to imagine the Thatcher transformation without Mrs Thatcher. That said, this was no one woman band. She worked closely with a group of senior ministers who were fully bought in to the approach. She could not have achieved what she did without them.
Acknowledging the unmeasurable
There was something else that was extremely important. Although economic historians who confine themselves to the statistics may miss this effect, anyone who lived through those years will know better: Mrs Thatcher changed the zeitgeist.
Under her leadership, it became desirable, even cool, to work hard and to aspire to succeed. For good or ill – and plenty of people thought, and still do think, that the apparent elevation of the importance of individual economic advancement and the apparent denigration of “community” were distinctly ill – Mrs Thatcher and her leading ministers changed the economic climate in this country. So much so, that they even managed to change the Labour Party. You cannot get much more radical than that.
And this had an extremely important economic effect. For probably the first time in recent British history, putting aside various macro events and crises, there was a broad continuity in the approach to economic policy which lasted for about 25 years from 1983 to the GFC of 2007/9. What’s more, both households and businesses came to believe in this stability, having witnessed a transfer of political power to Labour which did not bring a radical change of tack.
So it was not just that the micro policies of the Thatcher government were broadly right but also this continuity, mirroring what happened, for very different reasons, in just about all the other countries examined in this study, was critical in sustaining the UK’s outperformance after Mrs Thatcher’s downfall.
Next chapterII Germany after the War – An Economic Miracle? : 1945-1973.
The scale of the challenge confronting those who wished to rehabilitate the West German economy in 1945 was immense.10Germany and West Germany here are used interchangeably, unless otherwise stated. With ten million dead, 81% of its urban housing stock destroyed and 740 of its 958 strategically important bridges destroyed by Allied bombing, the war had exhausted the country. That exhaustion was reflected in its industrial production, which in 1945 was achieving barely 10-15% of pre-war output. Responsibility for economic policy transferred to the Allied occupation forces, but many of the components of the centralised Nazi economic regime remained in place, including price controls, rent controls and production quotas. Black market activity remained widespread.11Walter Laquer, Europe in Our Time: A History of 1945-1992 (1992); Johannes Ritterhausen, “The Postwar West German Economic Transition: From Ordoliberalism to Keynesianism”, IWP Discussion Paper, No. 2007 (1) p.20
Nor initially was there a clear plan for what course of action should be taken to revitalise the German economy. Different schools of economic thought existed which disagreed intensely on the most fundamental questions about recovery – from those committed to the continuation of a command economy or advocating Keynesian demand management, through to liberals demanding a transition to free markets and the removal of controls.
In the face of these unfavourable conditions at the outset, the West German economy grew at an average annualised rate of 15.9% between 1947 and 1949, and 8.8% in the 1950s, with GDP per capita growing at a similar pace. (See Table 1.) Between 1951 to 1960, unemployment fell considerably, and real wages went up by 5.6% annually on average. At the same time, after a spike in the late 1940s, inflation remained persistently low over the course of the decade. Germany replaced a severe current account deficit with a significant surplus and emerged as a European economic powerhouse in the period.
Some detractors are inclined to ask what all the fuss is about. After all, they say, it was inevitable that Germany would recover rapidly after the war, making full use of all the technological advances that had occurred in the meantime, just as all other European countries did. Yet, as we will show, the picture is much more complicated. For a start, although all of Europe staged a strong recovery, German growth was stronger than anywhere else in Europe, with only Austria coming anywhere close. Secondly, this German experience after the Second World War contrasts sharply with what happened after the First.
At any rate, contemporary commentators were in no doubt that something remarkable had happened. They took to describing a German Wirtschaftswunder, or “economic miracle”, and it is a period of economic growth that has been unparalleled in western Europe since.
How can we explain this quite extraordinary, sustained improvement in economic performance and German living standards? The subject has fascinated economists concerned with economic growth for decades, as academics and policymakers have looked for lessons from the Wirtschaftswunder for the present.
Two broad positions have emerged in the literature, and these might be categorised as the postwar catch-up argument, and the institutional argument. While the first focuses on structural changes largely out of the control of policy-makers, the institutional argument pays more attention to the contingent decisions made by those in positions of responsibility in the period. Of course, there is likely to be a grain of truth in both these explanations of postwar German growth. It is thus worth taking each of them in turn.
Postwar Catch-up Growth
The idea of a German economic “miracle” suggests that what took place was broadly out of the control of the country’s policy-makers. For some, the strong performance of the West German economy in the 1950s can be explained by so-called growth “convergence”, particularly the shift of labour from agricultural to industrial employment. Germany was slower than many other countries to emerge from an agriculture-dominant economy, even if it remained pre-eminent in some sectors of manufacturing. In 1938, 25% of the German workforce was in agricultural employment, compared to just 5.4% in the UK.
In contrast, the sectoral restructuring that occurred after the war was considerable. As shown in Chart 1, primary sector employment almost halved between 1950 and 1960 as a percentage of total employment, and continued to fall to 8.6% in 1970. At the same time, employment in the secondary and tertiary sector as a proportion of the total grew from 42.1% and 33.6% in 1950 to 47.6% and 38% in 1960. This raised the marginal productivity of labour considerably.12“Table 1” in Barry Eichengreen and Albrecht Ritschl, “Understanding West German Economic Growth in the 1950s”, Cliometrica, Vol. 3 (3) p.46.
Another factor in growth potentialities concerns the availability of capital, and indeed, this was something that economists at the time raised as a potential impediment to economic recovery.13See for example Wilhelm Ropke, A Humane Economy: The Social Framework of the Free Market (London, 1960); and Ludwig Erhard, Prosperity Through Competition (New York, 1958) pp.165-7. Germany in the postwar period had low capital to labour ratios, according to one study, about 12% smaller than that in the UK in 1938 and 29% lower in 1950.14“Table 1”, Eichengreen and Ritschl, “Understanding West German Economic Growth in the 1950s”, p.46. Other things being equal, lower capital means lower output per worker.
Chart 2 shows capital intensity - the total capital stock to total hours worked ratio - and demonstrates that the availability of capital was limited in the first half of the twentieth century, before improving dramatically after 1950. Between 1945 and 1960, capital intensity increased by over 80%.
Contemporaries recognised that improving the supply of capital was essential to improving German economic performance in the aftermath of the Second World War. Mind you, this explanation can only get us so far. There is a critical question to be answered about what enabled the vast increase in capital intensity to be achieved in West Germany.
Another argument has been advanced which suggests West Germany’s exceptional growth rate post 1945 was the result of recovery from wartime destruction. The destruction of the country’s physical capital stock – in addition to the aforementioned low capital to labour ratio – kept output below its potential. It also raised the marginal productivity of capital and set the conditions for a prolonged economic expansion.
Yet West Germany’s physical capital stock was not nearly in as bad a condition as one might naturally assume. Data on Germany’s wartime economy is limited, but Table 2 provides estimates of industrial assets in the area which would comprise West Germany between 1936 and 1948. By the end of the war in 1945, despite defeat and occupation, German industrial capacity was 3.5% greater than in 1939. Wartime destruction, in addition to high investment and replacement, also meant that the country’s industrial capital stock had a favourable age structure.15Eichengreen and Ritschl, “Understanding West German Economic Growth in the 1950s”, pp.196-7.
And again, this reconstruction interpretation of the Wirtschaftswunder fails to explain how and why German society exploited the opportunities after 1945 to grow rapidly. A comparison with the Weimar period is instructive: after the Great War, instead of expanding rapidly, the German economy stuttered. Punitive reparations imposed on Germany after 1918 are part of the explanation but by no means explain everything. Chart 3 shows that between 1918 and 1930, real GDP per capita grew at an average annual rate of 2.8%; between 1950 and 1960, by contrast, it grew by 8.1%.
While world industrial capacity was over 40% above pre-1914 levels by the end of the 1920s, German industrial capacity was just 14% higher.16Wendy Carlin, “West German Growth and Institutions, 1945-90”, in Nicholas Crafts and Gianni Toniolo (eds), Economic Growth in Europe since 1945 (Cambridge, 1996) p.461. Germany also suffered from a low investment rate in the interwar period; gross capital formation as a percentage of GDP averaged 9.8% per annum between 1925 and 1930; between 1950 and 1955, it averaged 20.7%. Thus, any account of post 1945 growth in Germany must account for why that period saw such an investment boom, while the 1920s did not.17Ibid.
There is a different case to be made about postwar German economic growth: that decisions taken in the period drastically altered the country’s growth prospects, and economic and political actors materially changed institutions and incentive structures to boost the overall level of investment and productivity in Germany after the Second World War.18See Mancur Olson, The Rise and Decline of Nations (New Haven, 1982). It is to these considerations that we turn next.
The Marshall Plan Explanation
Was German economic growth the product of a deliberate strategy? For some it was certainly the result of a “plan”, albeit not one drawn up by the Germans, but rather the United States’s “Marshall Plan” for European recovery and reconstruction. Described by Churchill as “the most unsordid act in all of history”, the Marshall Plan was an immense programme of grant funding for countries affected by the 1939-45 war and was legislated for in the Economic Cooperation Act of 1948. The Marshall Plan relieved a severe dollar shortage in Europe and in Germany at a time of high demand for American imports, and the counterpart funds – essentially vouchers for aid funding – helped to stimulate badly needed investment in German industries.19Tyler Cowen, “The Marshall Plan: Myth and Realities”, in Heritage Foundation, US Aid to the Developing World (Washington DC, 1985) pp.63-66.
The Marshall Plan is widely revered for having facilitated the German economic revival. Yet as a number of economists have come to recognise, such an interpretation has serious limitations. As Tyler Cowen puts it:
American aid never exceeded 5 percent of West Germany’s GNP, even in 1948-49, at the height of ECA [Economic Cooperation Administration] assistance. At the same time, Allied occupation costs and reparations absorbed from 11 to 15 percent of West Germany’s GNP. U.S. policies, therefore, caused German resource problems – [it] did not cure them.20Ibid, p.64.
But there was a particular aspect of the Marshall Plan that caused its benefits to be greater than implied by the mere amounts of money given. The disbursement of tranches of Marshall Aid was made conditional upon the recipients dropping tariffs on eachothers’ exports, thereby encouraging the development of a large European market which should enable the realisation of economies of scale, mirroring what happened in the United States.
Mind you, it should be noted that many other European countries were recipients of money from the Marshall Plan and were the beneficiaries from the progressive reduction of tariff barriers but they failed to achieve as much economic progress as Germany did.
Ordoliberalism and the Social Market Economy
German “supergrowth” might not have been down to the plans or actions of the United States, then. But there is good reason to believe that a different strategy and policy programme at the time did have an enormous bearing on the country’s economic fortunes.
Even before 1945, people had begun to think about what a post-war German economy ought to look like. For a body of individuals, the primary impediment to prosperity and economic vitality was the Nazi “Zwangswirtschaft” or coercive economy, with its controls and centralised planning. Thinkers like Wilhelm Ropke and the Freiburg academic Walter Eucken were certainly making a moral case about the relationship between economic regimes and the human individual, but they were also advancing an economic one too: that prosperity and growth were not possible in a “collectivist” system. Competition, free exchange and market mechanisms were required if Germany was to recover in the post-war period. This school of thought has come to be known as “ordoliberalism”, meaning liberalism within a framework of institutions and shared values.
These were not the rarefied, abstract arguments of academics, though. They were positions on the essential question of what was to be done to reboot Germany and avoid repeating the events that followed the Great War three decades previously. And in Ludwig Erhard, who would serve as Economic Director in the American-British occupation zone and who would go on to be Minister for Economics and then Chancellor of West Germany, they had a keen advocate.
Eucken himself was a key adviser to Erhard while he served as Economic Director. In 1952, he wrote a book called the Principles of Economic Policy which gives a good guide to the principles and policies advocated by the ordoliberals in the period. First and foremost, ordoliberals argued for an Ordnungspolitik – in which the state’s function is to set up, maintain and enforce a regulatory and institutional framework within which market interactions take place – rather than a Prozesspolitik – in which the state intervenes arbitrarily and on a case by case to achieve certain outcomes.
Eucken suggested a number of “constitutive” principles for such an order, which included a functioning price mechanism, price stability, the openness of markets, private property rights, the right to enter into contracts (so long as these did not compromise competition), the principle of liability, regulatory and consistency in economic policy and the interdependency of all these constitutive principles.21Manuel Worsdorfer, “Walter Eucken: Foundations of Economics”, in Thomas Bierbricher (ed), The Oxford Handbook of Ordoliberalism (Oxford, 2022) pp.91-114. At its most basic level, the ordoliberal position was one of deep scepticism of central planning, and a championing of free markets – an embrace of planned decentralisation.
Theirs was not an unqualified championing of free markets, though. Of course, many of these principles would have been endorsed by the Austrian school of economists – the likes of Ludwig von Mises and Frederick Hayek. But what distinguished the ordoliberal position was its emphasis on the institutions and values that undergirded functional markets. To this end, Eucken advanced an additional set of “regulative” principles which would ensure that markets did not degenerate or become self-serving. They included the containment and correction of monopolies, the redistribution of income to support the most disadvantaged, the internalisation of negative market externalities and the mitigation of the effects of excessive labour supply (like mass unemployment or wages below subsistence-level).22Ibid.
As mentioned above, the ordoliberal position was not unanimously supported; far from it. Indeed, there was considerable opposition to the relaxation of macro controls and the shift away from central planning between the end of the war and 1948. But while there was extensive disagreement amongst the critics of the ordoliberal position, the latter benefited from a degree of consensus about the fundamentals of a desirable economic agenda and support from other defenders of free markets. Thus, within the “Beirat” – the council of economists established to advise the West German authorities in the Bizone – ordoliberals came to dominate.23Johannes Ritterhausen, “The Postwar West German Economic Transition”.
Currency Reform, Savings and Investment
How did the ordoliberal model come to be implemented through policy? For Erhard, there was a clear sense of staging: first and foremost, Germany had to get a grip of its currency. The Reichsmark was in excessive supply and people had entirely lost confidence in it as a means of payment and store of value. A reliable, stable currency was a precondition for economic recovery: it would give individuals confidence to save and invest, businesses to take risk, and households to plan for the future. As Erhard wrote himself, to achieve this, the German authorities would be required to “keep to the narrow path between inflation and deflation”.24Ludwig Erhard, Prosperity Through Competition (New York, 1958) p.34.
On 20th June 1948, the Bizone withdrew the Reichsmark (RM) and replaced it with the Deutsche mark (DM). Reichsmarks were convertible at a ratio of 1:1 for up to 40 DM per citizen, at 6.5% for bank deposits and at 10% for mortgages and private debt. Firms were also granted 60 DM per employee. The upshot was that the German money supply was reduced to around a tenth of its previous level. These reforms were complemented with the lifting of 90% of the price controls that were in place the following month.25Ibid. The effect, as contemporaries observed, was transformative. As two Frenchmen put it at the time:
“On the eve of currency reform the Germans were aimlessly wandering about their towns in search of a few additional items of food. A day later they thought of nothing but producing them. One day apathy was mirrored on their faces while eon the next a whole nation looked hopefully into the future.26Jacques Rueff and Andre Piettre, quoted in Erhard, Prosperity Through Competition, p.13.
Inflation had been “suppressed” by the coercive economy through price controls. Despite the huge monetary contraction, when these controls were lifted, prices rocketed. Inflation peaked at 25.2% in 1948. (See Chart 4.) And in the short term, this was combined with a spike in unemployment. In November 1948, Labour unions called a general strike and pushed for a resumption of controls. Yet by 1949, inflation had abated, and inflation would remain remarkably low and stable for the next decade. After a peak of 11% in early 1950, unemployment fell steadily until the 1960s, while Chart 5 shows the employment rate rising by over one percentage point per annum throughout the 1950s.
Currency reform established the background conditions for economic growth. But Erhard recognised that this alone would not deliver increased prosperity for Germany. Government action was needed across a range of areas, even if that action was in accordance with the principle of a Ordnungspolitik economy. In particular, efforts were made to incentivise both household and business investment. In the case of the latter, high depreciation allowances were introduced in addition to other tax concessions, and with the improved profitability of German businesses that derived from the lifting of price controls, investment thrived. Unions displayed wage restraint too on the tacit agreement that profits were ploughed back into businesses through investment (although the high supply of labour probably undermined the unions’ negotiating position anyway).27Carlin, “West German Growth and Institutions, 1945-90”, p.467.
In the immediate postwar period, the rate of private savings was low. In 1949 the German Government cut individual income tax by roughly 50%, and specific income tax deductions were made available for forms of saving, including investment in cooperative societies and other forms of organisation approved by the tax authorities.
A 50% tax cap was placed on the profits of unincorporated businesses too, so long as the owner restricted their withdrawals for private consumption to a certain threshold and earmarked retained profits on their books either for reinvestment or for the purchase of long-term securities approved by the tax authorities. And by retaining certain consumption taxes, the Government sought to enlarge savings and promote investment while not releasing too much consumer spending power into the economy at a time when the currency reforms were just bedding in. 28Walter Heller, “Tax and Monetary Reform in Occupied Germany”, National Tax Journal, Vol.2(3) (1949) p.215-31.
Charts 6, 7 and 8 show the cumulative effects of these policies on savings, consumption and investment. The savings rate as a percentage of GDP in Germany grew by around a percentage point per year during the 1950s, from 28% to over 38.4%. Consumption as a percentage of GDP decreased from 64.7% to 57% in the same time period, while gross capital formation as a proportion of GDP increased steadily from 19.3% in 1950 to 24% in 1960. While data is patchy for the wartime period as noted, at its lowest point, gross capital formation in the postwar period was still considerably higher than the peak interwar level.
Housebuilding
Much of this increased investment found its way into the housebuilding industry. Some 2.3 million dwelling units had been destroyed or rendered permanently uninhabitable by the war. In the years 1949-1957, West Germany built over four million privately-owned dwelling units, which amounted to an increase in the housing supply of 5% each year. The housebuilding rate per 10,000 inhabitants grew from 46 in 1949 to 111 in 1956. (See Table 3.)
This housebuilding boom was facilitated by tax incentives, not just on the demand side in the form of support for mortgage saving, but also on the supply side: an accelerated depreciation allowance was approved for housing in 1949 which permitted the writing off of 10% of the construction cost in the first two years, and a further 3% annually for ten years. There was also a device in place between 1950 and 1954 which required lenders to advance loans to developers building social housing free of interest; such loans were deductible from taxable income with no limits. Altogether, some DM 65 Billion was invested in private residential construction between 1950 and 1957, 66% of which came from private sources.29Robert Wertheimer, “The Miracle of German Housing in the Postwar Period”, Land Economics, Vol.34(4) (1958) pp.338-45.
Competitiveness and Exports
The title of Erhard’s book about German postwar recovery is Prosperity Through Competition, and Erhard himself makes much play of the anti-cartel legislation he passed, as well as the government’s support for small and medium sized businesses at the time in promoting German competitiveness. And it is striking that Germany did not suffer from the urge to create “national champions” in key industries which was a leading theme in French economic policy-making.
But there was another major factor which is seldom given enough attention: a sharp rise in the population. Despite more than 8 million slave labourers being repatriated or emigrating, because of returning soldiers and refugees from the territories that were transferred to Russia and Poland and from Eastern Europe, between 1946 and 1950, West Germany’s population increased by 9%.30Eichengreen and Ritschl, op. cit. Between 1950 and 1962, another 3.5 million people entered from East Germany. The significant surplus of labour, partly a result of these inflows, certainly helped to keep wages down and ensure the profitability of investment.
As Table 4 shows, in the 1950s, wages grew more slowly than GDP. This surplus of labour also undermined the strength of the trade unions and diminished their role in economic policymaking. Undoubtedly, this helped German competitiveness.
In the early 1950s, the Korean War also created significant demand for investment goods, like machinery, equipment and plant. Germany, with its strong industrial capacity, was well positioned to capitalise on this boom in demand. Raw material shortages, however, particularly of coal, necessitated government intervention to ensure investment in domestic coal production, as international prices soared.
These interventions complicate Erhard’s own depiction of Germany’s postwar trajectory as the inexorable march of the social market economy, but it is true that the conditions which necessitated government action very quickly ceased to hold. In his opposition to a more dirigiste response to the shortage in raw materials, Erhard ensured that Germany did not retreat from the fundamental shift towards free markets that he had instigated.31James Van Hook, Rebuilding Germany: The Creation of the Social Market Economy (Cambridge 2004) p.229 Exports boomed in the 1950s, doubling as a percentage of GDP, and in the ten years up to 1960 Germany ran a current account surplus. (See Chart 9.)
Interestingly, since 2000, Germany’s current account surplus has grown very significantly while, as a share of GDP, consumption has fallen. The formation of the euro was the prime cause of the surplus as Germany entered the common currency at a competitive rate, while several other member countries continued to experience relatively fast inflation, without having the ability to devalue their currency to compensate.
The Hartz labour market reforms, introduced between 2002 and 2005, were also highly important in improving Germany’s competitiveness and their success against powerful opposition potentially has lessons for the UK today. The reforms included new conditionality clauses for unemployment benefits, a reduction in the level of unemployment payments (previously, such benefits were tied to a person’s salary), and later a reduction in the maximum entitlement length. These changes helped to increase labour market flexibility, create incentives for the unemployed to return to work, reduce early retirement and cut labour costs.
In many ways, that the SPD coalition government was able to implement these labour market reforms was remarkable. They were immensely unpopular in Germany, and cost the then chancellor Gerhard Schroder his job as chairman of his party, within which there was considerable opposition to the measures.
Nevertheless, the government gave much consideration to the political tactics of how these unpopular yet vitally important reforms might be delivered. Schroder appointed an expert committee (the Hartz Commission) to make recommendations on improving the labour market, which published its final report just prior to the federal elections in September 2002. Schroder then approved the proposals, and the election provided a democratic mandate for them. This gave the government political cover when it inevitably came under fire.32Glyn Gaskarth, The Hartz Reforms… And Their Lessons for the UK (2014).
On top of this, the government avoided reforms that might prove so divisive as to derail the wider agenda, including those relating to collective bargaining. Initially, the government targeted a constituency without union representation – the unemployed. This too limited the scale of organised opposition to the reforms. Furthermore, consensus over the need to tackle labour costs and unemployment meant that the reform programme continued to be pursued even after a change of government in 2005.
The measures worked. After rising in the first few years after the reform agenda was instigated, unemployment later fell substantially. The comparison with France is particularly telling. From 2003 to 2008, unemployment was higher in Germany than in France. But in the next few years, the German unemployment rate fell to only 5.4% in 2012, whereas the French rate rose to 9.8%.33Ibid.
Germany’s export success in the early post-war years and subsequently was not all about new ways of doing things. One of Germany’s strengths was its vocational training system, which had deep historical roots. Germany’s great success in the “miracle years” was closely associated with industries like chemicals and machinery where she had long been a world leader. Later on, the German car industry was a major beneficiary of the huge expansion in intra-European trade.
And one of the factors behind the success of post-war German economic policy-making, especially in comparison with the UK, is rather surprising. Because of the writing down of the country’s debts in the currency reform of 1948 and the London Agreement of 1953, the German government had a very low debt to GNP ratio and accordingly debt interest payments were low, allowing tax rates to be lower than they would otherwise be. By contrast, the UK was lumbered with massive debts incurred during the war. In 1950, Germany’s debt to GNP ratio was 19.7% compared to the UK’s 193.5%. A decade later, the figures were 17.4% and 107.7% respectively.34Barry Eichengreen and Albrecht Ritschl, op. cit.
The government’s activities in the 1950s make it clear that social market economics did not mean laissez-faire policy; Government was needed to foster the environment in which prosperity might be achieved. Yet critically, ordoliberals at the time did not believe that securing economic growth was under their control. In fact, they believed quite the opposite – that it was the free acts and decisions of millions of individuals that would determine Germany’s potential. As Erhard put it in his book Prosperity Through Competition:
All my economic policy measures are based on the criterion of how human beings will react to them, and what the consequences of any changes in economic circumstances would be for them… I do not believe that the idea of “a German miracle” should be allowed to establish itself. What has taken place in Germany during the past nine years is anything but a miracle. It is the result of the honest efforts of a whole people who, in keeping with the principles of liberty, were given the opportunity of using personal initiative and human energy. If this German example has any value beyond the frontiers of the country it can only be that of proving to the world at large the blessings of both personal and economic freedom.35Erhard, Prosperity Through Competition, p.116.
Some have critiqued the idea that the post-war period entailed any great policy or institutional change - that it was defined more by continuity than alteration – and that as such the primary driver of German growth did not lie in these particular arrangements. There was, it is argued, no “stunde null” or blank slate moment after 1945.
Indeed, Barry Eichengreen and Albrecht Ritschl argue that Germany’s post-war establishment was keen to project the image that post-war economic reform marked a complete departure from the state socialism of the Third Reich.36Op.cit. In fact, they argue, there was a good deal of continuity.
Yet to say that policymakers at the time made use of existing institutions is simply to confirm a key principle of the social market approach to the economy – that strong embedded institutions are vital to a healthy dynamic economy. It was changing the incentive structures for individuals and communities that interacted with those institutions that counted.
And the salience of the institutional setting is only further highlighted when postwar Germany’s experience is considered in comparative relief. The post-war West German economy outperformed the Weimar Republic, as it did East Germany after 1949. The common denominator in both these cases is that West Germany had a set of institutional arrangements that fostered profitability, encouraged savings and investment, and created incentives for enterprise and industry at the level of the individual. Although many of the reconstruction growth conditions are unique to the post-war German context, a “plan to do away with planning” holds many lessons for economic policy-making today.
Answers to the key questions
In the introduction to this study, we posed several key questions, the answers to which we hoped to find in our investigations. For Germany’s Wirtschaftswunder, these are our answers:
Was there a plan?
Germany’s economic growth was predicated on a move away from planning and towards Ordnungspolitik – a model in which the state’s function is to set up the framework for private enterprise to succeed but does not seek to intervene arbitrarily to achieve particular outcomes. The intellectual underpinnings for this shift were provided by the ordoliberal school of thinkers, including Wilhelm Ropke and Walter Eucken.
They made the case not only that economic growth and prosperity were impossible under a collectivist, command economy, but that such an economic system was fundamentally immoral too. Ordoliberals argued for the re-establishment of the price mechanism, currency stability, free markets, the strengthening of property rights and competition. They also contended, however, that a functioning free market depended on other institutions to contain monopolistic behaviour, support the most disadvantaged, mitigate negative externalities and prevent both mass unemployment and wages below subsistence level.
The reformers did not fully achieve this economic ideal. Nevertheless, there was a strategy for bringing the German economy into closer conformity with this ideal – a “plan” to move away from “planning”. Ludwig Erhard, the key actor in the period, believed that currency stability, the price mechanism and market competition were necessary pre-conditions for achieving prosperity in Germany. In 1948, he reduced the money supply to a tenth of its previous level and lifted 90% of price controls. In so doing, he managed to walk the tightrope between inflation and deflation in the short term and achieve currency stability within two years. Without this stability, he argued, such an economy was “unthinkable”.37Erhard, Prosperity Through Competition, p.7.
One key German strength was the widespread understanding, as in France, that there had to be major reforms. Devastating defeat made radical institutional and structural reform possible in Germany, whereas victory enabled and even encouraged the UK to muddle along, much as before. One beneficiary of the country’s shared understanding was labour relations, which were much better in post-war Germany than in the UK.
How long did it take for improvement to be clear?
The rate at which Germany’s economic fortunes changed was remarkable. Erhard’s currency reforms and lifting of price controls took place in 1948. Shortages, except in certain raw materials were cleared rapidly. After an immediate surge in inflation, the Deutschmark stabilised in 1949. By 1950, savings and investment were rising, consumption and unemployment were falling, and wages were rising but at a slower rate than GDP.
Were there losers? And how was support for reform sustained?
In the immediate aftermath of the currency reforms there was a severe spike in unemployment, which precipitated a General Strike in November 1948. Yet the short-term inflationary effect of releasing price controls quickly abated. Unemployment fell consistently from 1950 onwards. In terms of economic policy-making, the German unions were significant losers in the period. A very loose labour market – largely due to high levels of immigration – undermined their negotiating position with business. This was a critical factor in wage restraint in the period.
More generally at the outset, there were many ideological opponents to the radicalism of the pro-liberalisation reforms. These ranged from Marxists who believed in the validity of central planning on a principled basis, to Keynesians who continue to believe pragmatically in a mixed system of market incentives within a planned framework. Supporters of liberalisation benefited from the fact that their opponents were largely divided over what level of state intervention in the economy was appropriate, or what the correct targets should be. Ordoliberals were able to unite around their shared confidence in a social market economy to deliver efficient outcomes.
Did the transformation involve a radical restructuring?
Yes. Germany moved from the Nazi Zwangswirtschaft command economy to a free (or social) market one in a matter of months. Price controls were lifted, shortages eliminated, and competition encouraged. Equally, there was a fundamental sectoral restructuring of the German economy. In 1950, 24.3% of the workforce was in primary sector employment, 42.1% were in secondary sector employment, and 33.6% were in tertiary sector employment; in 1960 those figures were 13.6%, 47.6% and 38% respectively. In other words, a huge shift away from the primary sector and towards the secondary and tertiary sectors took place.
Was there a sequencing of reforms and was this ideal?
Both the ordoliberals in the Beirat – the Bizone’s economic administrative authority – and Erhard himself believed that currency reform and stability were required before functioning markets and economic growth could be secured. This was far from ideal, and immediately painful. Nevertheless, the broader situation in Germany after defeat in the Second World War probably created the space necessary for such radical measures.
Did the transformation involve much higher savings ratios by households and/or the whole economy?
A remarkable increase in the savings ratio occurred in Germany in the 1950s, and it was driven both by efforts to secure positive real interest rates through currency reform and via shifting tax incentives away from consumption and towards savings. Savings as a percentage of GDP in the decade to 1960 increased by roughly one percentage point each year.
Was the transformation the work of one key person?
Ludwig Erhard played a pivotal role in delivering Germany’s economic transformation, and in delivering his policies in the face of considerable opposition. It is reported that when he learned of his plans to drastically reduce the money supply, General Lucius Clay, the officer responsible for allied forces in occupied Germany, said “Herr Erhard, my advisers tell me you’re making a terrible mistake”. Erhard replied “don’t listen to them, General. My advisers tell me the same thing”. Erhard showed strong convictions in sound money and in free markets, and he was calm in weathering the challenge posed by inflation and unemployment immediately after his reforms were introduced.
But it is also important to note the role of the ordoliberal economists in the period, whose ideas had a significant bearing on the policy-makers in the postwar period. They created a climate of opinion in favour of free markets, and in their prescriptions for a social market economy, they offered a vision of a German model that would produce prosperity for all.
Next chapterIII France after the War – The Thirty Glorious Years: 1945-1973.
There used to be a perception in Britain and the United States that France was somewhat culturally indisposed to economic growth.38Charles Kindleberger, Historical Economics: Art or Science? (Berkeley, 1990). Arguably, the historic French attachment to an economic model based on ancient agricultural practices, small family businesses and a balance between agriculture, industry, and services, combined with a general reticence towards change, made for a society unconducive to the creative destruction necessary for economic expansion and improving productivity.
This negative impression is one that, historically, French political leaders have been all too aware of. In 1954, the then French Prime Minister Pierre Mendès France argued that a reputation for being economically “backward” and “weak” had diminished the country’s standing in the international community.39Warren Baum, The French Economy and the State (Princeton, 1958) p.1.
Yet as Table 1 and Chart 1 show, in the three decades that followed the end of the Second World War, France managed to deliver impressive levels of growth year after year. (In France this period is known as “Les Trente Glorieuses” or The Thirty Glorious Years.) Between 1946 and 1949, French GDP per capita grew at 19% on average per annum; in the 1950s it grew at an average annual rate of 3.6%, and at 4.8% in the 1960s. (See Table 1.) The UK’s economy, by comparison, grew at an annual average rate of 0.8% (0.4% per capita) between 1945 and 1951, and at an annual average rate of 3.6% (3.1% per capita) between 1950 and 1973.
France’s expansion is all the more remarkable when compared with preceding periods: France saw per capita growth of 1.8% per annum between 1896 and 1913, and 2.2% from 1913 to 1929. French economic growth after the Second World War was also smoother than growth in other countries in those decades.40William James Adams, Restructuring the French Economy: Government and the Rise of Market Competition since World War II (Washington DC, 1989) p.6.
How, and why did the French economy grow in such a way after 1945? And what were the ideas and values which drove such growth in a country that superficially seemed ill-suited to the change and churn of economic transformation?
Playing Catch Up
In the popular imagination, the French had, along with the other Allied powers, “won” the war. But this is to overlook the situation that confronted France in 1945. It is probably more accurate to say that she had lost the war, only to be liberated by the Allies in 1944. At the war’s end, less than half of French railways were serviceable. Coal production was 60% lower in 1945 than in 1938.41Baum, The French Economy, p.19. Industrial production in 1944 was just 38% of its 1938 level. And in the immediate postwar period, policy-makers had to confront an economy that had been starved of investment not just for the period of German occupation, but for the best part of fifteen years: the depression of the 1930s had seen “net capital” (adjusted for depreciation and obsolescence) decrease.42Pierre Sicsic and Charles Wyplosz, “France”, in Nicholas Crafts and Gianni Toniolo (eds), Economic Growth in Europe Since 1945 (Cambridge, 1996) p.217.
Of course, all this meant that post-war France had enormous scope to grow. After a prolonged period of population stagnation – both as a consequence of low birth rates and the 1.4 million excess wartime deaths in the Great War – in common with other countries, France was to experience a “baby boom“ which led to a significant expansion in its population (a 27% increase between 1954 and 1982), and this in turn improved the country’s growth prospects in aggregate terms. There also remained a significant proportion of the labour force in comparatively unproductive agricultural employment; moving such individuals into more productive work represented a sizeable per capita growth opportunity for the economy.
Critics will argue that, as in the rest of Europe, given the initial conditions after the war, France’s rapid post-war recovery was all but inevitable. There is something in this critique, but the argument is lacking a crucial perspective.
Growth potential is not the same as growth. As Chart 1 shows, after 1918, even a France that had been victorious on the battlefield struggled to grow. There was, in other words, nothing inevitable about France’s economic trajectory post World War Two. A case needs to be established then for why the French economy recovered after the Second World War, rather than stagnating and declining as it did after the First.
Monnet and the Plan de Modernisation et d’Equipement
One development critical to the upturn in France’s economic fortunes concerned the country’s cultural attitudes to change and modernisation. In reflecting on the humiliation that the French had suffered in 1940, a widespread sentiment grew that the seeds for such a failing lay in the economic under-performance of the 1930s. More specifically, this sentiment attached itself to a disaffection with a particular economic class. The patronat, those incumbent businessmen and capitalists who dominated industry before the war, had operated on a model that contemporaries called “Malthusianism” – a form of interest group economics in which industrialists and agriculturalists:
“maintain production at a relatively low level to assure high prices for sales. They thus assure survival of the least profitable units . . . and occasionally even require the state to finance activities which have no interest for the national community . . . Mechanization and rationalization are held back; investment is limited . . . Prices are no longer competitive with foreign prices . . . Since the national market is limited, the forecasts of overproduction become justified along with the Malthusian measures which the industrialists and the agriculturalists demand”.43Kindleberger, Historical Economics, p.185
It was “Malthusianism” that had left France lagging its European – and international – competitors, and vulnerable to aggressors in 1939. And it was this broken model that the French public realised, if only at an instinctive level, that they needed to overcome. Modernisation and growth, then, were just as much about national pride and security as they were purely about economics.
As the chief of the Provisional Government of Liberated France, Charles de Gaulle was the figurehead of France’s recovery in the immediate post-war period. But the intellectual force behind the French growth agenda was Jean Monnet, a French civil servant who had been working for the British mission in Washington DC since the French surrender in 1940.
In 1945, during a visit to President Truman, de Gaulle met Monnet, and the latter impressed on the former the necessity of French economic modernisation. Appealing to “Une certaine idée de la France” perhaps, Monnet told de Gaulle, “there will only be greatness when the French are of a stature to warrant it…. They must modernise themselves, because at the moment they are not modern. They need more production and greater productivity. Materially, the country needs to be transformed”.44Sherill Brown Wells, Jean Monnet: Unconventional Statesman (Boulder, 2011) p.96.
Both de Gaulle and Monnet had been struck by the level of prosperity during their time in America and came to believe that modernisation was necessary if France was to recover its international standing. Additionally, with the end of lend-lease, France also required new debt financing from the United States, and thus needed to demonstrate to the Americans that they had a strategy for raising productivity and generating the revenues to pay off their loans. De Gaulle invited Monnet to devise a plan for precisely that.
Monnet’s Plan de Modernisation et d’Equipement (adopted in 1947 by the Blum government that followed de Gaulle’s administration) – the first of a number of plans introduced after the war – was as the title suggests, a “plan” for economic recovery. But it was based on a very different attitude to the role of government than that which is generally suggested by the idea of “planning”.
The stagnation that had occurred under a period of relative laissez-faire economic policy (between the Franco-Prussian War and 1939, the French state owned few enterprises, had a proportionately small tax-take, and intervened little in the market), coupled with the fact that some in the patronat class had been willing collaborators with the Germans, led many to conclude that the state would need to play a more significant role in the economy.45Roger Price, A Concise History of France (Cambridge, 1993) pp.319-20. But Monnet did not believe that the Soviet-style planning being implemented in the USSR was the model for France. As he put it:
“Our action had to be at once less dictatorial and more specific: we had to persuade, not compel, private enterprise to act in accordance with public needs. The best way… was to… jointly seek the common interest which no one of them could determine alone, but in which all of them had a share.”46Wells, Jean Monnet, p.105.
Elsewhere, he put it that:
“ours would not be an attempt to direct the economy… in the first place, the regulatory apparatus of government was not to be placed in the hands of the planners; and those with the nominal authority to regulate were unlikely to surrender it to us in practice. In the second place, however, and probably more important, I continued to believe that nothing is more powerful than persuasion”.47Adams, Restructuring the French Economy p.106.
The Monnet plan, then, embraced a policy of “économie concertée”. The responsibility of government was to provide a sense of constancy and consistency to business about its long-term objectives, to work with industries in securing the conditions they needed to flourish, and to incentivise activities that conformed with the objective of modernisation and growth. The Monnet Plan established a team of advisers within the Planning Commission that were attached to the head of government, rather than any particular ministry, in order to avoid jurisdictional difficulties and to give a sense of policy continuity.
In furnishing an environment conducive to economic recovery, Monnet had a clear sense of staging. The government prioritised public investment for reconstruction and modernisation in six basic industries, including coal, electricity, transport, iron and steel production, cement works and agricultural machinery and fertiliser. Of course, this meant investment in other sectors – particularly housing and consumer goods – had to be delayed in the context of scarce resources until the second, “Hirsch” plan of 1954-57. But it was felt that investment in these areas was a prerequisite to more basic transformation in the economy, and would have strong positive externalities.
It is worth pointing out that the government did support significant investment in alternative energy sources too. By 1960, almost a third of French energy usage was supplied by oil, and there were concerns about the exposure which derived from reliance on imported energy. As such, investment was made into hydro-electricity – some 48 hydroelectric power stations were built between 1949 and 1957 – and nuclear, where early on in the post-war period France benefited from significant reserves of uranium in its colonies.48Frances Lynch, The French Economy (London, 2021)
Investment, Consumption and Tax Incentives
In general accordance with its “indicative”, rather than command planning model, the French state took ownership of relatively few enterprises in non-financial activities. But in the key industries mentioned above, particularly coal and electricity, the government did often predominate. And critically too, it dominated in financial services. As Pierre Uri, one of Monnet’s advisors, put it: “the state was needed to solve financial problems. It was the only way to transfer whatever savings there were into the current investment that France needed. Since we had no other resources, the state had to play a role in our reconstruction and modernization”.49Wells, Jean Monnet, p.101.
From the 1950s, considerable adjustments to the tax system were introduced. While, for example, the proportion of total tax receipts from VAT went up from 20.6% in 1959 to 27% in 1969, corporate income tax as a proportion of overall revenue decreased from 6.6% to 4.7% over the same period. (See Table 2.) 50Adams Restructuring the French Economy, pp.92-4.
The Government played an interventionist role in ensuring that increased savings translated into productive investment. By the 1980s, three large state-owned banks accounted for 62% of deposits. The government used finance as the main transmission mechanism for its policy agenda. State-owned banks provided loans and equity capital on favourable terms to stimulate investment; as William Adams notes, many such banks could offer debt to customers at rates below other financial institutions, or with a form of interest subsidy, and the government could provide equity infusion to companies with a lower dividend requirement than other private investors.51Adams, Restructuring the French Economy, pp.62,67,68
The combined impact of changed incentives and government intervention in bank lending is reflected in Charts 2, 3 and 4. Between 1953 and 1970, the savings rate increased from 22.2% to 28.7%. Over the same period, consumption fell from 61.3% to 54.3%, and gross fixed capital formation grew from 19.8% to 25.7%. There was, in other words, a concerted effort to squeeze consumption and boost investment.
Despite the changes to the tax structure set out above, tax revenues as a percentage of GDP rose over the period, from 32.4% in 1959 to 35% in 1970, as Chart 6 shows. Public spending also increased, from 35.3% to 40% of GDP in that time. (See Chart 7.) Chart 5 shows that between 1950 and 1970, an annual average of 18.2% of fixed capital formation was carried out by the public sector.
The vast majority of investment, nevertheless, was done by the private sector. Credit guidance was the preferred policy lever for directing investment to specific areas of the economy. Either way, an increasing proportion of the French economy’s resources either directly passed through the finances of the state or was directed towards particular sectors via publicly-owned financial institutions. 52Baum, The French Economy and the State, p.116.
Productivity
Investment certainly helped to improve French productivity in the period, but the modernisation agenda included regulatory reform and a restructuring of the labour market too.
The consequences of France’s modernisation programme can be seen most concretely in two sectors, the first of which is agriculture. At the end of the war, around a third of the country’s workforce was employed in agriculture. As noted above, previously, many had assumed it to be a strength of the French economy that it achieved a balance or “harmony” between agriculture, industry and services, but this static view failed to take into account both the unproductive farming methods employed in the country, as well as the relatively higher GVA of other industries53Lynch, The French Economy. .
Rene Dumont, a prominent agriculturist at the time, persuaded Monnet to focus his efforts on modernising agriculture through investment in new machinery.54A disastrous harvest and food crisis in 1947 which necessitated significant imports of wheat from the US on the basis of a dollar loan further convinced policymakers of the need for reform. The number of tractors in use increased from 34,000 in 1939 to 120,000 in 1950, the quality of seeds improved, and the use of fertiliser and irrigation expanded greatly. Agricultural productivity increased as the number of people employed in agriculture and the expanse of land used for agricultural purposes fell while output rose (See Table 3.) 55Kindleberger, Historical Economics, pp.171-3.
France’s economic development did not derive simply from improved productivity within individual sectors, but a restructuring of the labour market itself. Jean Fourastié, who joined the French government as an economic adviser at the end of the war, theorised that economic growth is driven principally by shifts in a country’s labour force towards more productive employment. The French experience largely mirrored this theory. Between 1946 and 1954, the population engaged in agriculture, fishing and forestry (agriculture predominating), fell from 36% of the total workforce to 28%. (See Chart 8.) From 1960 to 1970, that proportion fell further from 22.4% in 1960 to 14.3% in 1970, while employment in industry rose modestly from 37.8% to 39.5%. (See Chart 9.)
These changes were not the direct intention of government policy. They were, however, the indirect consequence of improved agricultural productivity, which reduced the demand for farming labour, and expanded employment opportunities in industry and services driven by increased investment.
Another area which was extensively modernised was retail. Generally speaking, France’s retail sector before the war was characterised by small, family-owned businesses with high profit margins, as well as a tax code that taxed those profits minimally and discriminated against chain stores or those with large store spaces. The market position of these firms was also protected by a moratorium on the creation of new, larger variety stores. The sector was, in other words, uncompetitive and offered limited inducements for firms to upscale.
In the late 1940s and early 1950s, the moratorium on new variety stores was lifted and a tax on the self-employed was introduced which removed some of the disincentives for larger stores.56This, as noted below, was repealed by de Gaulle when he returned to power. The first supermarkets subsequently opened in the late 1950s, and whereas just 1% of food purchased by French households came from supermarkets at that time, by 1984, the figure had risen to 18%. Supermarkets tended to locate in the suburbs of urban conurbations, and such areas were usually competitive, containing more than one supermarket. Productivity in food industries in particular increased by 1.7% per annum from 1950 to 1958 and by 3.5% per annum between 1958 and 1973.57Sicsic and Wylosz, “France”, p.220.
One other interesting thing to note is that French economic growth was not driven by increases in employment, or indeed by targeting a particular level of employment in the economy. Employment fell from 54.4% to 52.1% in the decade up to 1970, for example, even as the economy continued to grow. (See Chart 10.) France’s economic expansion was thus the product of per capita output improvements, rather than a significant enlargement of the workforce: total factor productivity on average grew by 3.7% annually between 1955 and 1970. (See Table 4.)
International Context: The European Economic Community
Domestic policy-making clearly had a decisive impact on the prospects for growth and modernisation in France after the war. But so did French trade policy and the wider international context. And although the Government had no control over international market dynamics, it did make a number of decisions that affected France’s interaction with, and exposure to, global trade.
The most salient development in the period was the creation of the European Coal and Steel Community (ECSC), and its successor, the European Economic Community (EEC). Once again, the main intellectual force behind these developments was Monnet. He worried greatly that in the postwar period, there was a risk that the lessons of the previous half a century would not be learned, and that France and Germany would once again slip into a destructive, hostile relationship. The key to avoiding this situation, he believed, concerned coal and steel, which he wrote “were at once the key to economic power and the raw materials for forging weapons of war”. “To pool them across frontiers”, he continued, “would reduce their malign prestige and turn them instead into a guarantee of peace”.58Wells, Jean Monnet, p.129.
Monnet’s proposal was that France and Germany should enter into an agreement to pool their coal and steel resources and create a common market in these goods which would be directed by a supranational institution (the “High Authority”). In 1949, Monnet pitched his ideas to Robert Schuman, the French Foreign Minister at the time, and the proposed plan was received well by Konrad Adenauer, the German Chancellor.
The ECSC was established in 1951 by the Treaty of Paris and ratified in 1952 by France, Germany and four other participating nations: Italy, Belgium, the Netherlands and Luxembourg. In 1957, the six members of the ECSC agreed to deepen their economic integration by agreeing to a common external tariff, eliminating trade quotas between signatory states and creating a customs union. The European Economic Community (EEC), the organisation charged with fostering this economic integration, was created via the Treaty of Rome in 1957.
The initial logic for these ventures was geopolitical, rather than simply economic: concessions of sovereignty were designed to guarantee security rather than advance productivity or economic specialisation. However, economic policy-makers also recognised that French economic recovery depended on access to Ruhr coke for steel production and coal from the Saar region. Increasingly competitive European markets also had a significant structural effect on the French economy. By restricting the amount of subsidy that governments could provide and loosening constraints on imports, membership of the EEC incentivised domestic enterprises in France to become more competitive.
Decolonialisation also tilted the French economy further towards richer, more competitive nations. Previously, colonies had accounted for a significant percentage of French trade. In the automobile industry, for example, imperial exports as a proportion of total exports went from 16% in 1913 to 46% in 1938. More generally, by 1935, Algeria was France’s largest trading partner. After independence, however, former colonies started to diversify and import more from other nations, exposing French exporters to greater competition; Algeria accounted for 19% of all French exports in 1958; eight years later, it was just 4%.59Adams, Restructuring the French Economy, p.180.
Chart 11 shows how much the openness of the French economy increased in the postwar period. From 1950 to 1980, imports went from 12.9% to 22.5% of GDP, and exports from 15.3% to 21%. It is worth noting, however, that much of this import and export growth took place after the period in which the French economy grew especially rapidly. In 1973, for example, imports remained at 16.9% of GDP, and exports were 17.5%, not dramatically higher than their respective levels in 1950.
As we discussed in relation to Germany, France benefitted from the Marshall Plan, including from the conditionality of Marshall disbursements on recipients dropping tariffs on eachothers’ exports. As well as increasing the scope for economies of scale, this increase in openness intensified competition in the domestic economy.
Nevertheless, openness did not generally extend to the foreign takeover of French companies. Indeed, the French state was decidedly protectionist in its attitude to the perceived interests of big French companies.
Économie Concertée
France’s period of serious economic growth came to an end with the oil crisis of 1973/4. But in the postwar period up to then, it witnessed a quite staggering period of economic modernisation and expansion.
It would be wrong to attribute a complete consistency to French policy over the three decades after 1945. Early on, for example, industrial strategy had a far greater bearing on the economy than after the formation of the EEC, which removed – or at least diminished – a number of policy levers formerly available to the French state. Nevertheless, a sentiment that modernisation was required and that economic growth was a prerequisite for France regaining its international prestige did remain constant and widespread throughout French society.
Policy-makers at the time sought to capitalise on this apparent consensus, and this was reflected in the style of state intervention that France adopted. As Monnet put it, “the French economy can’t be transformed unless the French people take part in its transformation. And when I say ‘the French people’, I don’t mean an abstract entity: I mean trade unionists, industrialists, and civil servants. Everyone must be associated in an investment and modernisation plan”. The indicative économie concertée was the political manifestation of this outlook.
French economic planning was distinctive. It combined different traditions of thought from the country’s past – from the Colbertist belief in the necessity of strong state intervention to the Turgotist belief that free markets were the means to prosperity and economic growth. And thus, while state expenditure as a proportion of GDP doubled between 1938 and the 1960s, the French government simultaneously took active steps to increase the competitiveness of its firms in both domestic and international markets by removing controls.60Ibid, pp.250-1.
The economic growth plan was founded upon a number of pillars: an increase in the investment rate (at the expense of consumption) through realigning tax incentives; productivity improvement in sectors of the economy through supply side reforms; and a restructuring of the labour market towards more productive forms of employment.
The dynamic effects of policy decisions are often hard to chart, but these effects are just as important as quantifiable metrics like the investment rate. Of course, it is significant that the investment rate (gross fixed capital formation) rose from just over 18% of GDP in 1950 to almost 27% in 1974. 61Roger Price, A Concise History of France, p.326. (See Chart 4.) As Chart 12 shows, throughout the period under study, French investment was consistently and considerably higher than that in the UK.
But equally consequential was the significant shift in the incentive structures that took place in the post-war period. Across French society, investing in innovation, modernisation and improvement became more rational for households and businesses than protecting existing positions or incumbency advantages.
This points to a more general fact about the French post-war experience: not all areas of growth were instigated by direct government intervention. Take housing. Prior to the Second World War, French housebuilding had trailed Germany and Britain. But between 1955 and 1979, France had a far higher private building rate than Britain, and housebuilding experienced a higher growth in output between 1959 and 1972 than any other sector of the French economy.62Lynch, The French Economy; and see Samuel Watling, “Why Britain Doesn’t Build”, Works in Progress, 23rd May 2023. Table 5 is a reproduction of an INSEE source and shows that the “value added” or total value of production in the housebuilding sector grew by 14.8% in those years. The key contribution of the Government here was fostering economic conditions supportive of private investment, and the provision of an indicative planning system which gave confidence to business.
Most importantly of all, perhaps, policymakers in France provided certainty to economic actors that the state would support investment, risk-taking and enterprise in the long run. In convening commissions composed of officials, industry bodies and labour representatives, they created a sense that the whole of French society was embarked on a shared mission to restore national pride on the world stage through increased economic prosperity.
In this regard, France was helped by the generally close rapport between business leaders and top government officials. Moreover, French civil servants were typically of a very high quality and blessed with technical competence which their counterparts in the UK generally lacked.
Answers to the key questions
In the introduction to this study, we posed several key questions, the answers to which we hoped to find in our investigations. For post-war France, these are our answers:
Was there a plan?
Postwar France had a plan for economic revival, but it did not seek to engage in planning. It had a clear sense of what was required for sustained economic growth and it provided a forum for communication and engagement between government and business. It also ensured access to finance for French firms and was activist early on in ensuring investment went to industries of fundamental importance to the economy as a whole, especially energy, transport and construction. Monnet and his team believed strongly that the state was required to ensure that savings were translated into investment in the parts of the economy where it was required the most.
However, the French state did not seek to dominate the economy, and contrary to popular perception, state-owned enterprises played a very limited role in most sectors until the 1980s, with the exception of financial services.63Adams, Restructuring the French Economy, p.62. French “indicative planning” was about helping the private sector to secure growth and modernisation and providing it with a conducive policy environment for those ends.
How long did it take for improvement to be clear?
France’s upward economic trajectory began instantly after 1945; indeed in 1946, the French economy grew 52% in real terms. However, much of the growth in the immediate period after the end of the Second World War was, as stated, more a reflection of recovery from wartime destruction and neglect. What is more impressive is that high rates of growth were sustained for so long. Two decades later, in the 1960s, the French economy was still growing at an annual rate of 5.7%. Consistent levels of growth over a prolonged period were probably key in ensuring popular support for expansionist government policies.
Were there losers? And how was support for reform sustained?
There was strong opposition to many of the government’s measures to increase competition and productivity, particularly in the retail sector. The small, specialist shops which dominated rural France, stood to lose a great deal from the development of larger, more productive supermarkets, as well as from the new tax on the self-employed introduced in 1948. Small retailers benefited a great deal from their privileged tax status and the barriers to new market entrants; removing these things produced a backlash in the form of the Poujadiste movement in the 1950s. Pierre Poujade, the owner of a small book and stationery shop in south-west France, acted as a lightning rod for disaffection with the modernisation programme, forming the “Union de Défense des Commerçants et Artisans” (UDCA) in 1953. The UDCA would go on to win 12% of the votes in the 1956 French legislative elections.
Protesters against reforms were militant. Small shopkeepers refused to pay their taxes and threatened tax officials. Poujadists managed to win important concessions from the government, including the abolition of the self-employed tax, and they would go on to have a considerable influence on a particular style of anti-establishment politics in France. Indeed, Jean-Marie Le Pen was a member of the UDCA in the 1950s.
However, they did not compromise the modernising agenda as a whole. Politically, De Gaulle’s concession on the self-employed tax when he returned to power in the late 1950s outflanked the UDCA, which promptly faded from prominence. Customers benefited from the increased convenience that came with the modernisation programme, and as living standards improved consistently, Poujadist resistance did never threatened to capture the sympathies of the majority.
Another powerful pressure group that could have scuppered the reform programme was the farmers. Agriculture needed to be radically modernised and there needed to be a substantial reduction in the number of workers employed in agriculture. Although it has been widely disparaged in the UK as an extremely wasteful policy, the Common Agricultural Policy (CAP) played a key role here. The generosity of the CAP to French farmers effectively bought them off and thereby paved the way for the modernisation of French agriculture.
Did the transformation involve a radical restructuring?
France’s economic growth was predicated on a significant restructuring of the economy, including a vast shift in employment away from the agricultural sector and into the manufacturing sector, as well as a considerable reorganisation of individual sectors such as retail and indeed agriculture itself. Raising agricultural productivity and increased investment in industry were the catalysts for shifts in the workforce.
There was also a considerable change in the tax incentive structure – towards investment and away from consumption – which had an effect across the economy, and a marked increase in competition, both through the reduced barriers to new market entrants and via increased exposure to international markets.
Was there a sequencing of reforms and was this ideal?
The Monnet Plan had a clear sense of sequencing at the outset of France’s growth period. The Plan de Modernisation et d’Equipement prioritised support for six basic industries, the view being that investment and modernisation here would have strong spillover effects for the rest of the economy and were a prerequisite for any significant transformation in French economic fortunes. These reforms were prioritised over investment in, for example, housing or consumer goods, which came later. Getting the basics right first was the strategy.
Did the transformation involve much higher savings ratios by households and/or the whole economy?
French policymakers did seek to make adjustments to the tax system to incentivise savings over consumption. The proportion of the overall tax burden made up by sales tax (the TVA) increased throughout the 1960s, for example, while the proportion made up by corporation tax fell. Income tax remained relatively stable. The consequence of these incentive changes was that the domestic savings rate as a percentage of GDP grew from 22.2% in 1953 to 28.9% in 1973.
Investment was also driven by public expenditure, and this was financed through increased tax receipts. Nevertheless, less than a fifth of gross fixed capital formation in the 1950s and 1960s took place in the public sector. (See Chart 5.) The direction of private savings through publicly-owned financial institutions remained the preferred transmission mechanism for increased investment.
Was the transformation the work of one key person?
Jean Monnet had an exceptional influence on France’s post-war economic recovery. He persuaded De Gaulle of the need for modernisation in the mid-1940s, he devised the strategy for shifting France towards a high investment economy with rising productivity, and he was instrumental in the early development of the European Community, membership of which would force French businesses and producers to become more competitive.
Three things ought to be added. First, Monnet succeeded because he built a highly effective team around him. Rene Dumont, for example, advised Monnet on the importance of modernisation and rationalisation in agriculture, and this was important in the latter’s decision to support investment in new agricultural machinery in the Plan de Modernisation et d’Equipement.
Second, Monnet – and indeed various politicians who led France in the decades that followed the Second World War – capitalised on a strong sentiment that France had a duty to restore the country’s standing in the international community. Monnet’s contribution was to help connect that national mission with the cause of economic growth and modernisation in French policy-making.
Third, France benefitted from having a cadre of senior civil servants who were exceptionally able and blessed with high levels of technical competence.
Next chapterIV Ireland – “The Celtic Tiger”: 1981-2020.
The Irish economy has had the most remarkable change in fortunes over the last century. Between the 1930s and the 1990s, Ireland went from a largely agrarian, low growth economy, with high levels of net emigration, budget deficits and considerable capital flight, to a high tech, high growth economy with budget surpluses, low indebtedness, high levels of foreign investment and net immigration. Between 1990 and 1999, Ireland grew at more than triple the rate of the British, French and German economies. (See Table 1.)
Since the 1990s, it has also witnessed one of the most uneven growth trajectories in the western world: having lagged most developed economies throughout the twentieth century, Irish GDP per capita grew by an average of 6.2% per annum in the 1990s, before experiencing a contraction on average of exactly the same rate between 2008 and 2009 – “the deepest and quickest economic contraction experienced by any country since the Great Depression”.64Paul Teague and Denise Currie, “Committing to Economic Openness in Ireland: The Importance of Domestic Institutional Capabilities”, in Augustin Fosu (ed), Development Success: Historical Accounts from More Advanced Counties (Oxford, 2012) p.185. (See Table 2.) This has since been followed by a resumption of strong economic growth.
Ireland’s growth story is partly about trends in the global economy: how the Irish economy benefited from them, and how it was exposed to them. But the story is more complicated - and more interesting - than this, and merits closer examination. This chapter will largely focus on the period around the turn of the millennium, but to understand the wider economic policy context of that period, it is worth starting earlier in the twentieth century.
As a brief methodological note, this chapter will generally use GDP rather than GNP as the primary measure for the size of the economy. There are issues with this, which will be elucidated further below; substantial operations in Ireland by large multinational corporations give rise to large dividends paid to foreign investors which contribute nothing directly to Irish living standards. The size of this effect is inflated by the practice of transfer pricing whereby such companies deliberately price inter-company transactions in a way that boosted profits in Ireland, where they pay a low tax rate. (See Table 3.)
Nevertheless, we have referred to GDP for several methodological reasons. For one, we wanted to ensure consistency and comparability across our case studies. Moreover, using GNP data would require various workarounds (e.g. modifying deflators, finding a suitable exchange rate for Irish pounds) which, in cumulation, may harm the integrity of the data. Finally, and despite the non-negligible differences between GDP and GNP, we do not think these differences lead to radically different conclusions about the Irish economy.65Another measure for the size of the Irish economy which is sometimes used is Modified Gross National Income (MGNI), which subtracts depreciation on two particular assets in order to minimise distortion from globalisation: intellectual property, and leased aircraft. (See Table 3 and Chart 13.)
Early Twentieth Century: Agriculture, Independence and Protectionism
Ireland was unique among European countries in that it remained a largely agricultural economy late into the twentieth century and failed to meaningfully industrialise. The historical reasons for this are complex. Of course, Ireland’s uneasy relationship with Britain was central, and resulted in the former mainly playing the role of primary goods exporter while the latter flourished as a manufactured goods exporter.
Yet important too was the precise way that Ireland began to break away from the UK. In seeking to resolve the “Irish Question” in the late 1800s, Irish tenants were awarded rights against their British landlords through a series of Land Acts. Yet these worked to greatly empower small scale landholders and farmers, producing an interest group that would gain considerable concessions from the state at the expense of urban and manufacturing interests. Poor industrial development in Ireland subsequently choked the spread of mass consumption that was taking place elsewhere and ensured that Irish households continued to be reliant on imported goods, which in turn produced a vicious circle of low investment in Irish manufacturing capacity.66Seán Riain, The Rise and Fall of Ireland’s Celtic Tiger: Liberalism, Boom and Bust (Cambridge, 2014) p.42.
This reliance on foreign imports eventually affected policy-making. After securing her independence from Britain in 1921, Irish economic policy at first remained broadly non-interventionist, with relatively free trade. But in the 1930s, resentment at the continued dependence on British exports in particular fomented calls for greater economic autonomy. Éamon de Valera, a key figure in the Easter Risings and leader of the Fianna Fail party at the time, was elected President of the Executive Council in 1932 and upon entering office immediately shifted the Irish economy towards greater protectionism.
Such a shift was crystallised in the Control of Manufactures Acts of 1932 and 1934. In an attempt to support the development of domestic industries, these Acts effectively prohibited foreign ownership of Irish industry by stipulating that Irish people had to control 51% of the voting shares in manufacturing companies. This presented a huge disincentive for foreign direct investment into Ireland, yet at the same time, Irish capital was allowed to move freely out of Ireland. Capital flight was widespread as Irish investors switched into British assets. Moreover, tariffs were imposed on imported goods.
These protectionist measures remained in place through the 1940s and most of the 1950s, and were a major cause of Ireland’s relatively stagnant economy. Irish GDP per capita growth in the 1950s was about 1.7%, compared with 2.8% in the UK, 3.6% in France and 8.2% in Germany. Low growth in turn led to a lack of job creation and high levels of emigration: net annual emigration was 36,000 per annum on average in the 1950s – a decade in which the country lost over 12% of its population to net emigration – as residents went abroad in search of economic opportunity. 67Antoin Murphy, “The ‘Celtic Tiger’ – An Analysis of Ireland’s Economic Growth Performance”, Robert Schuman Centre for Advanced Studies, Working Paper (2000) p.8; Migration Policy Institute, Re-emergence of Emigration from Ireland; New Trends in an Old Story (2015). (See Chart 1.)
Re-appraisal: Openness, Foreign Investment and Human Capital
By the late 1950s, with many European countries experiencing postwar economic booms, it was clear that the dominant protectionist paradigm in Ireland needed to be reviewed. This sentiment was expressed in a pair of influential documents published in 1958 – A White Paper entitled Economic Development and another called the Programme for Economic Expansion – which argued for the reduction in tariffs and liberalisation of trade and efforts to increase the investment rate by attracting foreign direct investment.
On this latter point, there was a clear recognition that in contrast to the preceding decades, industry would have to be re-orientated towards foreign markets in order to secure the investment necessary for growth: the aforementioned white paper noted “the insufficiency of our current savings as a basis for national capital formation on the scale which would be necessary to enable us even to follow at some distance the rising standards in the rest of Europe”.68Cormac Ó Gráda and Kevin O’Rourke, “Irish Economic Growth, 1945-88” in Nicholas Crafts and Gianni Toniolo (eds), Economic Growth in Europe Since 1945 (Cambridge, 1996) p.404. As such, the Control of Manufactures Acts were repealed in 1957.
In addition, Ireland looked to reset its trading relationship with the rest of Europe. In 1965, she signed the Anglo-Irish Free Trade Agreement with the Wilson Government, and later in 1973, she joined the European Community. This latter step had a significant structural effect on the Irish economy: in the 1960s half of Irish imports and exports were with the UK. Today, even with the geographical proximity between the two countries, that figure is more like a quarter.69Ireland did benefit from European structural funds too – that is, fiscal transfers between European states or grants which between the mid 1980s and the mid 1990s accounted for around 2.5-3% of Irish GDP. Nevertheless, studies have shown that these structural funds played a limited role in Ireland’s economic expansion. See Teague and Currie, “Committing to Economic Openness in Ireland”, p.177; and John Fitzgerald, “Lessons from 20 Years of Cohesion”, The Economic and Social Research Institute, Working Paper No.159 (2004).
As the economic historian Frank Barry puts it, Ireland’s new strategy was not “just a return to laissez-faire,”; instead, it was “an outward-oriented interventionist strategy”, in which the Government liberalised trade while actively seeking to court international companies to invest in the Irish economy. Critical in this agenda was the Industrial Development Authority (IDA), a state sponsored body tasked with fronting the country’s engagement with foreign firms. The IDA benefited from a first mover-advantage: no other European country had such an explicit and proactive strategy – as well as dedicated institutions – to win over multinational companies (MNCs), and the IDA ensured that a focus on attracting foreign firms and incentivising them to invest in Ireland was hardwired into policymaking over the long term.
The primary inducements offered were tax concessions: a zero percent rate of corporation tax on the profits of manufactured exports, and from 1981 a 10% tax rate on manufacturing profits and internationally traded services profits. Initially, ambiguities over corporate rates – what, for example, constituted “manufactured” goods – caused confusion. These were ironed out over time, however, and between 1987 and 1991, significant non-discriminatory tax cuts were introduced too.70EY, The Historical Development and International Context of the Irish Corporate Tax System (2014).
These exceptionally low rates made Ireland one of the most competitive tax jurisdictions in the world. Given the lack of a pre-existing industrial base in Ireland, these low rates could be sustained without considerably harming tax revenues and fostering large budget deficits. Chart 4 shows Irish tax revenues have fallen over time as a proportion of GDP, but corporation tax cuts did not drastically affect overall revenues for the government between their introduction and 2000; indeed, corporate tax receipts went up after the cuts, as did tax revenues. (See Charts 2, 3 and 4.)
Between 1995 and 2000, public spending as a proportion of GDP fell by around ten percentage points. (See Chart 5.) For reasons discussed below, this changed in the mid 2000s, as public spending increased rapidly between 2007 and 2010. In the 2010s, tax revenues and public expenditure have fallen again, suggesting a more permanent shift towards a small-state economy.
The fruits of this shift in policy are borne out in the data. Foreign firms accounted for 2.2% of GDP by the early 1970s, and MNCs were producing 40% of the country’s industrial output. In the 1990s, they were producing about two-thirds of all manufacturing output.71Teague and Currie, “Committing to Economic Openness in Ireland”, p.173. A competitive tax regime was a decisive factor in increased foreign investment, and the Irish Department of Finance itself has found that a robust relationship exists between the corporate tax rate and levels of foreign investment.72An Roinn Airgeadais, Literature Review of the Economic Effects of Corporation Tax (2014).
Initially, MNCs invested mostly in low-productivity sectors like food and drink, or the assembly of intermediary parts made elsewhere and sold abroad. Yet even this provided a welcome boost in employment. Later, from the 1970s onwards, the IDA was effective in identifying areas for future investment in more productive industries, and particularly in computers, computer software, chemicals, pharmaceuticals, and cola concentrates. Apple, Microsoft and Dell all set up manufacturing bases in Ireland in the late 1980s and early 1990s, and the former would come to have a disproportionate impact on the Irish balance sheet in the twenty first century. (See below.)
Ireland benefited from being an English-speaking country fully committed to Europeanisation at a time when the UK’s position on European integration looked uncertain. This, along with the considerable tax and regulatory incentives available, made Ireland an attractive destination for MNCs looking to sell products in European markets.73Murphy, “The ‘Celtic Tiger’”, p.13. Output in those five aforementioned sectors grew to 43% of total manufacturing output in 1993; this jumped to 53% of total output just three years later.74Ibid, p.15. FDI in high tech industries also had strong spillover effects for the rest of the economy, as investment created demand in other sectors, particularly legal and accounting services, as well as demand for office space, housing and hospitality services.
Chart 6 shows that the Irish savings rate has risen over time with a marked dip between 2005 and 2015, followed by a strong recovery. FDI began to take off in the mid 1990s, rising from 1.5% as a percentage of GDP in 1994 to 25.7% in 2000. From 2014 to 2015, the value of FDI inflows increased from $97bn to $237bn. A significant proportion of this increase derived from Apple’s decision that year to move its intellectual property assets to Ireland for tax efficiency purposes. (See Chart 7.) Chart 8 shows that gross fixed capital formation tracked these developments, rising from 17% of GDP to 23.7%.
Ireland also sought to make sure that it had sufficient human capital to benefit from MNCs operating in the country, and so there was a concerted effort to deal with historically low education standards. In the early 1960s, over 50% of children left school at 13. It was not until 1967 that free secondary level education was introduced. As shown in Chart 9, from 1989 to 2010, the percentage of 25-34 year-olds who had attained tertiary education rose dramatically from 18.3% to 48.3%.
Additionally, there was a considerable expansion in the role of Ireland’s institutes of technology (formerly technical colleges). In the 1960s, students attending these colleges were less than 25% of all third-level students. By 2012, they constituted about half the total. The IDA in particular encouraged these institutes to increase the number of graduates in fields relevant to the high-tech industries it had identified as sources of future growth. As such, Ireland succeeded in upgrading its labour force and ensuring that those entering it were prepared for the jobs created by MNCs with operations in the country.75Ibid.
Finally, the Irish Government worked closely with industry and the trade unions to ensure wage restraint in a policy called “social partnership”. Based on triennial wage negotiations, this model looked to complement Ireland’s broader attempts to attract foreign investment by ensuring that Irish labour costs remained internationally competitive. Wage restraint was in effect traded for cuts to income tax: between 1995 and 2001, the standard rate of income tax fell from 27% to 20%, and it is estimated that one-third of the increase in real take-home pay over this period came from tax cuts.76Frank Barry, “Tax Policy, FDI and the Irish Economic Boom of the 1990s”, Economic Analysis and Policy, Vol.33 (2) (2003)
As a result, even though nominal wages rose through the 1990s and early 2000s, these rises were lower than productivity gains, and so labour unit costs fell. Ireland was thus able to improve living standards at the same time as assisting profitability, which ensured both popular support for its economic programme and international competitiveness. Between 1991 and 2009, Irish labour compensation, the main factor in unit labour costs, remained lower than in the UK. (See Chart 10.) Yet real wages rose substantially during these years. (See Chart 11.)
Chart 12 shows that during the period from 1968 to 1988, Ireland’s current account was in substantial deficit. Since then, the situation has markedly improved, with the current account - excepting the year 1999 - in surplus between 1991 and 2003. In recent years, it has been extremely volatile.
Growth: Reality or Mirage?
It has often been argued that there was a degree of artificiality to Ireland’s apparently impressive economic performance. For some, this problem concerns the way that growth is measured. The high GDP growth figures in particular are liable to being distorted by the significance of MNCs, which remit substantial profits abroad. The effects of this are exacerbated by the practice of transfer pricing, whereby MNCs record as much of their global profits in low tax jurisdictions like Ireland as possible.
This explains the remarkable discrepancy between per capita productivity in US-owned companies and Irish owned businesses in the 1990s. One study suggests that net output per employee in a US owned chemical company in Ireland was £926,000, compared to £75,000 per employee in an Irish owned one.77Murphy, “The ‘Celtic Tiger’”, p.16. To the critics, Irish economic growth was largely American economic growth recorded in Ireland for tax efficiency purposes.
There is undoubtedly some truth to this interpretation of the record, but it is not the full picture, and there are good reasons to believe that growth in the 1990s reflected fundamental improvements in Ireland’s real economy. As Chart 13 shows, GNP and GDP followed a similar trajectory. Between 1990 and 2007, Irish real GNP, which excludes profits from MNCs operating in the country that are repatriated abroad, increased by 183%. GNP per capita increased by 126%. These improvements in per capita GNP were reflected in significant advances in living standards.
One of the principal drivers of the increase in output and incomes was an increase in the rate of employment, as shown in Chart 14, and a corresponding fall in the unemployment rate from 14.7% in 1991 to 4.5% in 2000. Between 1990 and 2005, the employment rate increased from 45.5% to 59.3%. In the ten years up to 1997, the number of jobs in the economy grew by 23%. In the same period, the US increased the number of jobs by 17%; in the UK, the figure was 3%, and among EU members states, the average was just 3%.78Frank Barry, Aoife Hannan and Eric Strobl, “The Real Convergence of the Irish Economy and the Sectoral Distribution of Employment Growth”, in Frank Barry (ed), Understanding Ireland’s Economic Growth (Basingstoke, 1999) p.19.
The transfer of people into more productive employment was also significant. From 1991 to 2000, less productive agricultural employment fell from 14.1% of total employment to 8%, with industrial employment remaining broadly stable and service employment increasing from 57.6% to 63.6%. (See Chart 15.)
Ireland enjoyed not only a considerable expansion in the size of its economy but also a convergence with European living standards: In 1970, Irish GNP per capita was 64% of the EU average; by 2000 it was 96% of the average, and is now significantly higher.79Teague and Currie, “Committing to Economic Openness in Ireland”, p.178.
Irish growth in the late twentieth century, then, was not just a mirage. It represented meaningful improvements in employment and productivity, which translated into higher living standards for the Irish people.
A second argument sometimes advanced is that Ireland’s experiences during the 2000s significantly undermined its growth model. In the 1990s, growth had been powered by exports and manufacturing (and rested on steady improvements in human capital, infrastructure, and trade competitiveness), But in the first decade of the 21st Century, the annual growth rate of real exports fell from 21.2% to 6%. Irish economic growth in the early 2000s was driven instead by a boom in construction and rapid credit expansion.80Morgan Kelly, “Whatever Happened to Ireland?”, Centre for Economic Policy Research, Discussion Paper No.7811 (2010) pp.1-25.
A series of tax incentives was introduced in the 1990s to encourage residential construction, particularly for regeneration and adding to the housing stock in urban areas. These served their purpose in attracting development and new residents, but also represented an incentive for the speculative substitution of capital into construction. At the same time, an immense expansion in the supply of credit took place. In 1998, capital gains tax was cut from 40% to 20%, and bank lending exploded, with total loans and advances to customers rising to 200% of GDP by 2007.81Commission of Investigation into the Banking Sector in Ireland, Misjudging Risk: Causes of the Systemic Banking Crisis in Ireland, 2011.
The majority of that lending was channelled into property and real estate. For example, from 2000 to 2008, the net capital stock of dwellings increased by 156%; productive capital stock - in infrastructure, public buildings and utilities - by comparison, only increased by 66%.82Rossa White, “Irish Macro Comment: Years of High Income Largely Wasted”, Davy Research (2010). Ireland went from getting 4-6% of its national income from housebuilding in the 1990s to 15% in 2006-7.83Kelly, “Whatever Happened to Ireland?”, p.14. Chart 16 shows that between 2000 and 2007, the value of loans going to real estate activities as a percentage of overall lending went from 9.9% to 27.4%, while the emergence of “ghost estates” testified to the excessive oversupply of new homes.
Like other developed economies, Ireland thus experienced a housing bubble in the early 2000s. Low interest rates, as elsewhere, were a factor in the inflation of property prices, but so was the increased size of loan products, and in particular the increasing number of mortgages offered with a loan to value ratio of 100%. When the bubble burst, demand plummeted, many mortgagors were thrown into negative equity and banks found themselves overleveraged with bad assets on their books.
In Ireland, this financial crisis became a fiscal crisis: the Government bailed out banks to avoid systemic failure, yet in doing so, Ireland’s budget deficit grew to 32.1% of GDP in 2010, and the net public debt to GDP ratio rose to 90% in 2013. (See Charts 17 and 18.) Austerity measures followed, but even with these interventions the Government was compelled to apply for financial assistance from the European Commission, the European Central Bank and the IMF – often referred to as the “troika”.84Teague and Currie, “Committing to Economic Openness in Ireland”, pp.186-7.
Ireland’s experience in the early 2000s represented a significant policy failure with substantial social costs, particularly in the form of rising unemployment. Nevertheless, despite its severe recession, Ireland’s economy recovered strongly following the Financial Crash, and in the decade up to 2019, GDP grew at average annual rate of 5.3%, while GNP increased by 4.4%. (See Table 3.) Public debt as a percentage of GDP fell from 90% in 2013 to 48.8% in 2019.
So the notion that Ireland’s experience of a property bubble undermines the strength of its claim to have transformed itself is false. For a time, demand was depressed but it recovered. Meanwhile, the supply-side strengths that Ireland had built up, including the quality of its human capital, its favourable tax rates and its appeal to MNCs meant that good growth could soon resume on firm foundations.
One might argue that Ireland’s development as a liberal, globalised economy dependent on foreign investment makes its growth model significantly flawed, that the differences between GDP and GNP and the severe recession of the early 2000s indicate that Ireland built its economic “house” upon sand.
But the growth experiences of the 1990s and 2000s suggests a different interpretation: that even if the influence of MNCs distorted Ireland’s GDP figures, and notwithstanding the fact that Ireland was particularly exposed to international headwinds, the economic growth experienced in the 1990s especially was real and translated into increased employment and productivity.
Answers to the key questions
In the introduction to this study, we posed several key questions, the answers to which we hoped to find in our investigations. For Ireland’s growth at the turn of the twentieth century, these are our answers:
Was there a plan?
Like many of the case studies examined in this paper, the Irish Government had a strategy for delivering growth, but it did not embrace planning. Well before the key period of study here, in 1958, the government white paper Economic Development set out the case for a liberalised Ireland – open to foreign trade and active in securing foreign investment to compensate for what were its low levels of domestic savings.
In the period under consideration, the Industrial Development Authority (IDA), initially set up in the late 1940s, was the government-sponsored agency responsible for the co-ordination of Ireland’s investment strategy. Its primary method was tax inducements; low rates of corporation tax were levied to attract multinational companies to domicile in Ireland.
A further element of Ireland’s growth strategy was to ensure that FDI translated into real improvements in the Irish economy. This was principally to be achieved by building a strong labour market, such that MNCs would not simply invest and remit profits abroad, but would create meaningful employment opportunities for Irish workers in productive sectors of the economy.
How long did it take for improvement to be clear?
Ireland’s journey to prosperity was a long one, and over many decades the country shifted away from an economy dominated by agriculture and with high levels of emigration to one dominated by services and high levels of inward investment. Specific policy interventions in some cases had a delayed impact too. The benefits of tax changes in particular took some time to percolate through the Irish economy; although the first significant cuts took place at the start of the 1980s, it was not until the 1990s that FDI, and indeed growth, really took off.
Yet in other ways, improvements took place rapidly. In the high growth period of the 1990s, as detailed below, a significant restructuring of the labour force took place in a remarkably short amount of time, with a material effect on productivity and GDP per capita.
Were there losers? And how was support for reform sustained?
Compared with other countries, many of the changes required to deliver economic growth in Ireland did not impose significant costs on particular groups. The changes to taxation are a case in point. While significant tax cuts in a country with a large, pre-existing corporate tax take would force challenging decisions on public spending, Ireland’s corporate tax base was far lower, and as such, cuts in corporation tax did not have an overwhelming effect on the public finances. (See Chart 2.)
What did have a significant impact on the public finances – and thus households across Ireland – was the exposure of the banking sector to the housing market bubble. In the late 2000s, a financial crisis became a fiscal crisis, as the government bailed out the banks and public debt soared. But this did not derail the Irish growth model. Strong growth soon resumed.
Did the transformation involve a radical restructuring?
Yes. In the middle of the century, Ireland began its transition from essentially a closed economy with capital controls and high tariffs to an open economy, with trade liberalisation, competitive tax rates and high levels of inward investment.
To take advantage of the FDI that had been secured through the active courting of MNCs and competitive corporate tax rates, Ireland needed a skilled labour force that could translate foreign investment into an increase in productive employment. This they achieved through significant improvements to human capital and upskilling.
As such, a considerable restructuring of the labour market took place in a relatively short period of time. In just eight years between 1991 and 2000, agricultural employment fell by 44% as a proportion of total employment. Manufacturing employment was stable, while market services employment grew by 10.4% in the same period.
Was there a sequencing of reforms and was this ideal?
There was a sequencing of reforms, in so far as creating an environment conducive to FDI was a necessary prerequisite to boosting investment in Ireland. The liberalisations of the mid-twentieth century were important parts of this endeavour, as were the reductions to the tax rate.
Nevertheless, one of Ireland’s strengths was its flexibility and capacity to respond to changes in the international economy. As set out below, the Industrial Development Agency was critical in spotting industries with high growth potential, pro-actively courting companies in those sectors to bring their business to Ireland, and finally with recommending broader reforms in the Irish economy to take advantage of that investment. In this way, Ireland’s growth was partly the product of having no fixed sequence of reforms in mind, but being nimble in adapting to developments beyond its shores.
Did the transformation involve much higher savings ratios by households and/or the whole economy?
To a large extent, no. Irish policymakers knew early on that domestic savings would not be sufficient to deliver the growth that the country needed, and that these would need to be supplemented by foreign investment. The policy focus of successive governments was on the latter, not the former. Irish savings today, however, are considerably higher than they were in the early 1990s.
Was the transformation the work of one key person?
Ireland’s economic transformation was less the work of one key person than one key institution: the Industrial Development Agency. While it would be wrong to attribute Ireland’s successes entirely to the IDA, it played a vital institutional role in embedding a coherent and consistent strategy into economic decision making. It coordinated efforts to court MNCs, promoted Ireland as a destination for investment, and even sought to influence Irish education policies to ensure a strong supply of skilled labour.
Next chapterV Poland – From Communism to the Market Economy: 1990-2020.
In 1996, Lech Wałęsa, Poland’s first democratically elected President, gave an address to students in Prague on the transformation of his country since the conclusion of the Cold War. The task of transitioning from a communist, totalitarian regime to a free society, he remarked, was rather like that of transforming a fish soup into an aquarium. In the economic domain in particular, replacing a centrally-planned economy with a market one was not a mere change in policy. It demanded a complete alteration in the country’s way of life.
Today, Poland is the poster boy for successful economic transformations. Poland’s story is an exceptional one. Since 1990, its real GDP has grown by 222% – more than any EU country barring Ireland, and indeed more than any of its former Soviet bloc peers with similar catch-up growth potential. (See Table 1.) According to World Bank data, on current trends, Polish GDP per capita is due to overtake that of the UK within the next ten years. Poland was also the only European economy not to experience a recession during the Global Financial Crisis of 2007-9.
Yet, in the immediate aftermath of the fall of communism, there was no reason to believe that Poland would out-perform other post-communist countries, or indeed European economies more generally. Indeed, based on the FDI flows into eastern and central Europe, it would seem that international investors had put their money on Hungary becoming the fastest growing economy in the former eastern bloc.85Marcin Piatkowski, Europe’s Growth Champion: Insights from the Economic Rise of Poland (Oxford, 2018) p.187. According to the World Bank, in 1991, Poland’s real GDP was 2.3 times the size of Hungary’s. Today, the Polish economy is almost four times the size of the Hungarian.
Behind these developments was a clear-sighted, comprehensive reform agenda which was pursued consistently over a sustained period by a number of governments. It was an agenda founded upon four pillars - macroeconomic stabilisation, liberalisation, privatisation and the generation of strong, market-friendly institutions. And it was an agenda that relied on important decisions being taken at critical moments, none more significant than the choice to pursue multiple significant reforms simultaneously in the early 1990s.
The Balcerowicz Plan and Shock Therapy
In 1989, the communist regime fell. In partially free elections in June, Solidarity – an independent trade union in Communist Poland that became the de facto opposition to the ruling party – won every single seat available in the lower house, and all but one of the hundred seats in the upper house. After negotiations and attempts by the communist Polish United Workers’ Party (PZPR) to cobble together an administration, Tadeusz Mazowiecki was selected by Solidarity to be the first post-Soviet Prime Minister of Poland.
The question of how to restore a functioning market economy in Poland, however, fell more specifically to Leszek Balcerowicz, the Minister of Finance. Faced with already spiralling rates of inflation, Balcerowicz made a deeply consequential – and contentious – decision: that wholesale reforms across a number of areas, including currency stabilisation, price and trade liberalisation, privatisation and taxation would be pursued all at once. In this, Balcerowicz was supported and advised by Jeffrey Sachs (who would also go on to advise Mikhail Gorbachev and Boris Yeltsin about Russia’s transition to a market economy).
The logic ran that, after the fall of Communism, the economic crisis that threatened to follow in its wake and the sense of shared national mission to rectify the situation presented an historical inflection point, and a unique opportunity to deliver structural changes in the country that would otherwise become bogged down or diluted through the political process.
It is curious just how similar the rationale for Poland’s shock therapy was to that which drove the currency reforms in Germany in the immediate postwar period. Indeed, when casting about for a suitable candidate for Finance Minister in his government, Mazowiecki said explicitly that he was searching for a “Polish Ludwig Erhard” – the West German Economics Minister and later Chancellor in the immediate post-war period who is widely credited with the series of shock measures which precipitated the country’s economic recovery. Balcerowicz himself had studied Erhard’s reforms as a visiting scholar at Marburg University in 1988.
On the 1st of January 1990, a range of reforms came into effect with three broad objectives in mind: to restore the price mechanism; to secure macroeconomic stability; and to address profligate state-owned companies. In the minds of the reformers, all of these objectives were inter-linked, and achieving them all would create the conditions for economic growth. Such reforms were required prior to more targeted initiatives in particular areas of the economy.
Price Liberalisation
In the first case, price liberalisation was introduced in order to eliminate shortages and to restore market signals and incentives for enterprises to increase production. Only the most socially sensitive prices, like those for gas and electricity, were freed up more slowly. International trade was also liberalised, exposing companies in Poland – many of which remained state-owned – to competition while providing them with new markets and an expanded customer base. The significance of these changes should not be overlooked; Andres Aslund writes that almost overnight, vendors were setting up market stalls across cities like Warsaw, and soon, these informal traders had become formal enterprises.86Andres Aslund, “Poland: Combining Growth and Stability”, CESIfo Forum, Vol. 14 (1) (2013).
Macroeconomic Stability
The constrained supply brought about by price controls under the communist regime led to high levels of forced savings in the country; put simply, there was little for Poles to spend their money on. So, once these controls were lifted, prices exploded as repressed inflationary pressures were released. As Chart 1 shows, in 1990, inflation hit 568%. To stabilise prices, a number of other measures were introduced. Firstly, the government sought to mitigate the wage-price spiral by imposing high marginal taxes on wage increases in the state-owned enterprises (SOEs) which continued to dominate the economy.
Secondly, a restrictive monetary policy was introduced too: while the zloty was made convertible, a creeping peg against the dollar was introduced, and interest rates were kept high.
The aim of policy was to secure positive real interest rates, such that firms and households would have confidence to save and invest in the currency. However, the effect in the short term was a fall in the savings rate as a proportion of GDP between 1990 and 1993 from 26.9% to 11.2%. (See Chart 2.) After prices stabilised, there was a rapid rise in consumption from 47% to 62%. (See Chart 3.) In the mid 1990s, the growth in domestic consumption tailed off and savings as a percentage of GDP began to rise again.
After the turbulence of the currency reforms, investment also rose quickly from 14.8% in 1992 to 24.9% 1999. (See Chart 4.) This was partly the result of increasing confidence in the zloty, but also of two other factors covered below - market incentives created by privatisation and foreign investment.
Private Enterprise
Finally, reforms were made to diminish the state’s dominance in the economy and increase the competitiveness of state-owned enterprises (SOEs). Firm budget constraints were introduced for SOEs and such companies were allowed to fail, which ended the previous practice in which profit-making SOEs effectively subsidised loss-making ones through the tax system.
Additionally, by prohibiting the central bank from financing budget deficits, subsidies for state-owned companies were significantly reduced from 10.5% of GDP to 7% in 1990. Through these measures, and in addition to the broad price and trade liberalisations, the Government signalled to SOEs that they would need to adapt and become more efficient to survive.87For a helpful list of all the major economic reforms in Poland after 1989, see World Bank Group, Lessons from Poland, Insights for Poland: A Sustainable and Inclusive Transition to High Income Status (Washington DC, 2017) pp.155-56.
In the short term, the pain from these changes was considerable. Recession immediately followed the transition away from communism; in 1991, GDP per capita fell by 7.3%. With prices soaring and large wage increases heavily taxed, many saw a real hit in their purchasing power. Indeed, opposition to government efforts to tighten domestic credit expansion was so strong that it had to be loosened.
Unemployment grew from virtually zero (there was no official unemployment in the formerly centrally planned economy) to 12.2% in 1991 and 14.3% a year later. (See Chart 5.) These social costs would spark increasing criticism both from economists like Grzegorz Kołodko, who would go on to serve as finance minister between 1994 and 1997, and Aleksander Kwaśniewski, the leader of the Social Democratic party in Poland, who would replace Wałęsa as President in 1995.
Nevertheless, Balcerowicz’s plan worked. His reforms were not intended to deliver immediate and rapid growth; indeed, tight monetary policy operated against this. Rather, their purpose was to secure the fundamental conditions for a market economy that would be capable of delivering growth over the long-term. Major transformations in the fortunes of the Polish economy would not appear until 1994. Even then, the Polish economy was the first post-communist country to start growing and would average GDP growth rates of 5.3% per annum between 1993 and 2000.
Privatisation
The political situation in Poland was turbulent after the fall of communism, and on average there was a new government every year. Critically though, even after multiple changes of administration, the reforms instigated by Balcerowicz were retained.
This robustness in the face of political turbulence demands an explanation. It lies with a combination of social consensus and success. At the beginning, there was general support for the policies being pursued. By the time that the consensus began to fray, the policies were showing sufficient success that they were retained.
Alone, however, shock therapy would not be sufficient to deliver sustained growth. Strong incentives for private enterprise would be required, as would widespread reforms in the public sector. The central policy in this regard was privatisation. In shifting from a centrally planned to a market economy, Poland had to address a situation in which some three quarters of its economy was state-owned.
The rationale for privatisation was clear. Given that information about the market is dispersed widely in the economy, diffusing and decentralising ownership of the means of production would lead to more efficient decision-making and resource allocation, and privatisation would generate incentives for work, enterprise and innovation – the foundations of a strong, growing economy.
Privatisation in Poland was not without criticism. The American economist Joseph Stiglitz in particular criticised the pace of the process, suggesting that an ideological policy of “privatise now, regulate later” meant power and capital accrued to narrow interest groups, generated new oligarchies and provided fertile conditions for corruption. This is certainly what happened in Russia and with dire consequences. Yet for Poland these charges seem wide of the mark. The Transparency International’s Corruption Perceptions Index 2016 had Poland as the 29th least corrupt nation out of 175 countries worldwide.88Today, Poland has fallen back to 45th out of 180 countries.
More importantly, there is little reason to believe that the privatisation process was rushed at all. In the short-term, while the number of private sector jobs increased substantially, this was partly due to new private firms entering the market as a result of the incentives provided by price and trade liberalisation, rather than simply the privatisation of existing SOEs. Indeed, in 1991, new firms in the manufacturing sector were responsible for 20% of job creation.
The broader reform package introduced in January 1990, including the changes to budget constraints and efforts to increase competition, encouraged efficiency in SOEs prior to their privatisation. Yet the legislation for large scale privatisations did not come in until April 1993, and significant conversions of state-owned companies into private enterprises did not really take place until 1996.89There were notable exceptions, such as the sale of 80% of Poland’s largest pulp and paper company to the American multinational International Paper in 1992. In that time, and as detailed below, a clear set of structures and incentives was devised to ensure that privatisations did not have adverse unintended consequences and contributed to economic growth and a diffusion of economic power.
When the Polish Government did come to legislate for privatisation, the scale of the programme was reduced from 2000 companies to 512 which accounted for about 10% of the book value of all SOEs – about a third of the size of the Czech Republic privatisations. The programme’s designers had three key imperatives in mind: firstly, to avoid the sale of too much of the country’s capital stock to foreign investors; secondly, to ensure that the privatisation process led to economically efficient outcomes; and thirdly, to promote the distribution of capital to generate domestic support for the privatisation and broader free market agenda.
To this end, fifteen National Investment Funds (NIFs) were established to manage the privatisation process for 512 SOEs. Every adult Polish citizen was granted a “universal share certificate” which was converted into a share in each of the 15 NIFs. The NIFs were listed on the re-established Warsaw Stock Exchange which guaranteed transparency, since the funds would have to provide regular and audited performance updates. The funds themselves also received 15% of the shares in each of the companies they supervised which incentivised managers to perform well and promote a return on investment. Together, the design of the privatisation process meant it was more transparent, more likely to contribute towards an enterprising private sector, and more Polish citizens had the opportunity to share in the proceeds.90Hartmut Lehmann, “The Polish Growth Miracle: Outcome of Persistent Reform Efforts”, Quaderni DSE Working Paper, No.822 (2012) pp.9-10, 16-17.
The Polish experience stands in stark contrast to Russia, where the privatisation process is generally agreed to have resulted in the concentration of wealth in an emergent oligarchy. The reasons for this are complex, but both the slower pace at which Polish privatisation took place and the particular design of the NIFs are likely to have been important factors. In Russia, privatisation happened more rapidly at the outset, and the vouchers offered to the public were fully transferrable, meaning that they were hoovered up by a relatively small number of individuals.91Hilary Appel, “Voucher Privatisation in Russia; Structural consequences and mass response in the second period of reform”, Europe-Asia Studies Vol.49(8) (1997); Christine Rider and Edward Zajicek, “Mass Privatisation in Poland: Processes, Problems and Prospects”, International Journal of Politics, Culture and Society, Vol.9 (1) (1995). In Poland, vouchers were not tradeable for a minimum period at the outset.
It is worth noting too that, unlike many former Soviet countries making the transition to a free market economy (with the exception of Hungary), Poland benefited from a sizeable pre-existing private sector, amounting to around a quarter of GDP. This meant that some legal infrastructure was already in place by the time of the Balcerowicz reforms, and also that this private sector, as set out above, was able to provide both a “cushion” for poorly performing SOEs and a “springboard” for the growth of private enterprise.92Piatkowski, Europe’s Growth Champion, p.181. Thus, Poland perhaps offered a more favourable climate for the growth of free markets and private ownership than other central and eastern European states.
Table 2 shows the scale of the restructuring that took place in Poland over the 1990s. State-owned enterprises went from constituting 86% of Polish GDP after the fall of communism to 29% in 1997. This shift from an economy dominated by the public sector towards one with a vibrant private sector was instrumental in Poland’s improving productivity. After a brief dip during the recession in the early 1990s, Polish productivity grew rapidly; from 1989 (prior to the fall of communism) to 2010, total factor productivity grew by 48.7% in real terms. (See Chart 6.)
Poland’s privatisation programme stands in stark contrast to the macroeconomic reforms pursued at the start of the 1990s. Whereas the latter were pursued rapidly, privatisation was a slower, more considered process. Time was taken to ensure a productive and equitable restructuring of ownership in Poland.
Sectoral Restructuring
There was a discernible shift in the balance of the Polish labour market in the period under study. (See Chart 7.) Between 1991 and 2010, the percentage of the total working in agriculture fell from 25.4% to 13.1%. Interestingly, jobs in industry were broadly stable, falling 2.5 percentage points to 30.3%. Jobs in services, by contrast, grew from 41.7% of the total to 56.6%. Compared to other case studies in this paper however, these shifts were not the driving causal factor behind Polish economic growth.
Tax and Public Sector Reform
In moving from a command economy to a free market one, significant changes to the tax system were also required. Corporation and personal incomes taxes were introduced in 1989 and 1992 respectively, and a value added tax was legislated for in 1993. In the late 1990s and early 2000s, changes were made to shift the balance of taxation away from production and towards consumption: corporate income tax was cut from 40% in 1996 to 19% in 2004 and the basic rate of personal income tax fell from 21% to 19%, while Poland maintained a comparatively high basic VAT rate of 22%.
The balance of tax revenues changed considerably too. (See Chart 8.) In 1995, corporate income tax, personal income tax and VAT constituted 10.6%, 28.1% and 24.7% of total government revenue respectively; in 2005, those figures were 8.75%, 13.6% and 42.1%. Taken together, these changes supported business growth and demand for goods and services.93World Bank, Lessons from Poland, Insights for Poland, p.17.
Equally important in the economic growth story of Poland were the public sector reforms taken towards the end of the 1990s, especially in health, pensions and education. These were instigated by Balcerowicz’s successor, Kołodko.94Grzegorz Kołodko, Strategy for Poland (Warsaw, 1993). In the case of healthcare, Poland moved to a system along the lines of the German model. Regional health insurance companies were set up and financed from a national health insurance surcharge, with some additional state funding for specialised treatment. Private payments were introduced for services not covered by health insurance companies. Health administration was devolved and healthcare providers rendered independent.95Lehmann, “The Polish Growth Miracle”, p.19.
Poland also looked to reduce its long term pension liabilities by moving from a defined benefit to a partly funded, partly defined contribution system with three pillars: a mandatory defined contribution scheme, a mandatory funded scheme managed by private institutions, and a voluntary private funded scheme The pension age, which had been approximately 55 for females and 59 for males with a range of early retirement schemes, was raised to 60 for females and 65 for males. Early retirement was effectively cut by having pension payments adjusted down according to the age of departure from the workplace. Some early retirement schemes or “bridging pensions” were politically challenging to phase out, and it was not until the Tusk administration that these schemes were dissolved.96Ibid, pp.7,22.
Pension reforms took time and political capital. Indeed, while the new three pillar system was introduced in 1999, the retirement age increase was not secured until 2012. As such, substantial reductions in the share of government expenditure in GDP did not really occur until the 2010s. 97Katarzyna Owsiak, “The Impact of Pension Reforms on Public Finance in Poland”, in Mehmet Bilgin et al. (eds), Eurasian Economic Perspectives: Proceedings of the 20th Eurasia Business and Economics Society Conference, Vol.2 (2017) (See Chart 9.)
Notwithstanding these changes to the Polish tax system and public expenditure, Charts 9 and 10 show that the public sector retained a significant presence in the Polish economy throughout its transformation. Poland did manage to lower the tax burden and government expenditure up until 2000, but tax revenue and spending as percentages of GDP began to rise again shortly afterwards. Poland, in other words, has succeeded despite high levels of taxation, which further underlines the importance of the structural shift in the Polish economy towards the private sector in driving increased productivity.
Finally, important reforms were made to the Polish education system. In particular, the tracking of students – where pupils were put on a path towards vocational training or general education – previously took place relatively early on in pre-tertiary education. This tracking was pushed back so that Polish students received comprehensive education for longer. Much of this worked to reduce the number of under-performing students in the school system.
Furthermore, the establishment of private universities was legalised, and with strong domestic demand for tertiary education, the annual number of university students grew precipitously: from 400,000 in 1990 to 1.7 million by 2012. This investment in human capital ensured an increasingly well-trained labour force and supported the expansion in the number of high-skilled occupations in Poland, which was higher than in the rest of Europe; in the decade to 2016, high-skilled, high-pay employment (that is, managers, professionals and technicians) increased by about 10%.98World Bank, Lessons from Poland, Insights for Poland, pp.139-40. Piatkowski, Europe’s Growth Champion pp.191-2
Poland vastly outperformed other former communist countries in improving education levels and human capital. As shown in Table 3, from 2000-2012, the tertiary attainment of 25-34 year-olds generally grew at a much faster rate than both Hungary and the Czech Republic.
Together, these reforms helped put the Polish public finances onto a more sustainable, long-term footing, reduced public expenditure, and built a stronger labour market.
Government Debt and the Banking Sector
Critics of some of Poland’s economic policies, particularly its tight monetary policy, suggest that the country could actually have grown more quickly if it had adopted a more expansionary position. Reflecting on the transition away from communism, Kołodko argued that there was a great deal of income and growth that should have been generated after 1989 but which has now been lost forever.99Kolodko, “A Two-Thirds Rate of Success: Polish Transformation and Economic Development, 1989-2008”, in Augustin Fosu (ed), Development Success: Historical Accounts from More Advanced Countries (Oxford, 2012) pp.290-1.
Yet the significance of the Government’s efforts to grip inflation and bear down on debt should not be under-estimated. (See Chart 11.) In the Financial Crash of 2007 to 2009, Poland was the only European country not to experience a recession while, according to Eurostat data, the average contraction in the euro area in 2009 was 3.7% in real terms. The downturn in Eastern Europe was more pronounced: “the Czech Republic, Slovakia, Hungary, and Bulgaria faced decreases of around 5 percent of GDP, while Romania experienced a decline of 7.2 percent, Slovenia saw a 7.8 percent downturn, and the Baltics had a 14–18 percent fall”.100Aslund, “Poland”. Poland’s economic resilience principally came down to the fact that in the preceding decade and a half, it repaired the public finances, cut debt and re-capitalised the banks.
In 1993, Poland’s Enterprise and Bank Restructuring Programme created a variety of avenues for banks to resolve their bad loans, from bank and court conciliation to the sale of debt (often in exchange for equity). This was in contrast to other countries suffering with financial crises in the 1990s, which created bad banks with responsibility for resolving non-performing loans. In Poland, however, banks were required to take responsibility for bad loans and become better at assessing credit risk, which improved the soundness of the banking sector and avoided the moral hazard of taxpayer bailout. Going into the financial crisis of the early 2000s, Polish banks were in a stronger position than those of many other states.101Sweder van Wijnbergen and Nina Budina, “Inflation Stabilisation, Fiscal Deficits, and Public Debt Management in Poland”, Journal of Comparative Economics, Vol.29 (1) (2001) pp.292-309.
The Polish government also cut debt rapidly, in large part by reducing public expenditure thanks to its public sector reforms. In this regard, a comparison with Hungary is instructive. While Poland managed to reduce its national debt rapidly from 84.1% of GDP in 1992 to 43.1% in 1996 at the same time as keeping government spending as a proportion of GDP broadly stable, Hungary’s public debt stood at 83.3% of GDP in 1994 while public expenditure remained over 50% of GDP – the highest in the region. Hungary continued to run budget deficits of around 8% in the early 2000s, contributing to its deteriorating public finances.102Lajos Bokros, “Reform Reversal in Hungary after a Promising Start” in Anders Aslund and Simeon Djankov, Great Rebirth: Lessons From the Victory of Capitalism Over Communism (Washington DC, 2014) p.46.
This meant that when the Financial Crash occurred, while Poland was in a position to increase public expenditure and deliver counter-cyclical spending to stave off recession, Hungary’s debt position meant it lacked such room for manoeuvre.
The fact that Poland outgrew all other former Eastern European countries also casts doubt on the notion that it wasted significant growth opportunities.
Trade and European Integration
After the fall of the communist regime, there was a strong desire across Poland to integrate with Western Europe. Part of this impulse was certainly cultural and concerned the Polish sense of identity; Poles considered themselves European, and the turn westwards was also an explicit turning away from the Russian sphere of influence.
In 1989, Poland signed an agreement with the European Economic Community on trade and economic cooperation, and in 1991 it became an associate member of the organisation. After the European Council stated its intent to enlarge the European Union in 1993, Poland took steps to secure its accession, in particular complying with EU requirements about institutions guaranteeing democracy, the rule of law and human rights and a functioning market economy. Poland formally became an EU member state in 2004.
In terms of Poland’s growth trajectory, EU accession had a number of direct and indirect implications. Most obviously, as one of the poorest European states when it first acceded, Poland was the recipient of considerable structural funding. Indeed, it has received more EU investment – including grants, subsidies and loans – than any other country since 2004, and €110 Billion between 2005 and 2014. In 2014, EU investment in Poland accounted for over 1% of Poland’s GDP, while EU investment in Czech Republic and Hungary only accounted for 0.10% and 0.02% of GDP, respectively. Much of these allocations were used to fund new transport infrastructure: the length of highways and express roads in the country has grown from less than 500km in 2000 to 3300km in 2017.103Piatkowski, Europe’s Growth Champion, p.193
European integration was boosting Polish exports well before its formal EU accession in 2004, thanks to the trade cooperation agreement signed in 1991 and Poland’s associate membership. Chart 12 shows just how much Poland opened up to international trade after the fall of communism. Between 1993 and 2012, imports and exports grew as a proportion of GDP by 109% and 139% respectively. Much of this growth came in European trade. In 1999, goods exports to EU member states equated to 13.2% of GDP; four years later, it was 20.1%.104Ewa Balcerowicz, “The Impact of Poland’s EU Accession on its Economy”, Centre for Social and Economic Research, Studies and Analyses No.335 (2006) p.18.
For most of the period since 1990, Poland has run a current account deficit. (See Chart 13.) It benefited from significant levels of FDI; net inflows of investment as a percentage of GDP grew from 0.1% in 1990 to 5.4% in 2000.
More indirectly, European integration dovetailed with Poland’s broader efforts to develop the institutions that undergird a healthy free market economy. Development of such institutions was just as much geopolitical as it was purely economic. Poland wanted to associate and integrate with Western Europe because it saw itself as culturally and historically European. But in charting a course towards re-integration, it adopted institutions and structures key for economic development, such as the strengthening of property rights in 1990 and competition regulations in 2001.105World Bank, Lessons from Poland, Insights for Poland, pp.155-56.
National Solidarity
One further important element in the Polish experience was the degree of consensus generated for the reforms. It is true that the shock therapy instigated at the start of the 1990s came with social costs in heightened levels of unemployment and high inflation, and certain aspects of the programme, particularly to do with the supply of credit, had to be loosened. But the broad thrust of the reforms undertaken was sustained and deepened by subsequent governments. Such perseverance meant that these difficult policy choices were given the time to bed-in and deliver results, which in turn gave the economic reforms legitimacy in the eyes of the public.
Critical to this stability in policy over time was the sense of a shared national project. Poland benefited from the strong sense of solidarity generated by the trade union movement in the 1980s, as well as the galvanising force of the Catholic Church, of which some 90% of Poles believed themselves to be members.106Piatkowski, Europe’s Growth Champion, p.224 At the same time, policy-makers consciously sought to ensure that the benefits of delivering economic growth were shared broadly across Polish society; the practical implementation of the privatisation process, in which Polish households were actively involved, is a case in point. This idea of a collective undertaking ensured domestic support for a process that would not yield results immediately, but over a period of time.
Answers to the key questions
In the introduction to this study, we posed several key questions, the answers to which we hoped to find in our investigations. For Polish economic growth after the fall of communism, these are our answers:
Was there a plan?
Yes, and it was called the Balcerowitz Plan. Conceived in late 1989 and implemented at the commencement of 1990, the plan was designed to facilitate the transition from a command economy to a free market one, and it had three key pillars: restoring the price mechanism and market signals; providing macroeconomic stability; and promoting private ownership. Prices were liberalised to eliminate shortages and to restore price signals, and the zloty was made fully convertible. To get a grip on inflation, high interest rates were set, and a high marginal tax rate on wage increases was levied for state-owned enterprises.
These policies were designed to give businesses and indeed households confidence in the currency, to achieve positive real interest rates, and in so do doing to spur saving and investment. They were heavily influenced by the example of post-war Germany, and the decisions of the then Finance Minister and later Chancellor, Ludwig Erhard.
The Balcerowicz Plan also laid the ground for the privatisation of the economy. By legislating to allow state-owned enterprises to declare bankruptcy and standardising taxes on private companies, the Plan created the legal framework for a vast expansion of the private sector. Shifting the balance of the economy away from state ownership towards private enterprise was intended to raise Polish productivity substantially.
Balcerowicz’s plan lasted until the middle of the 1990s. While the fundamentals of it were retained by successive governments, further plans were introduced by his successor Kołodko ( the “Strategy for Poland”) to reform the public sector, reduce long-term liabilities and cut debt. These were pre-envisaged steps designed to assist the development and functioning of a free market.
How long did it take for improvement to be clear?
Poland’s strategy was not designed to bear fruit straightaway. Indeed, the immediate consequences of the shock therapy in 1990 were rocketing inflation and rising unemployment. Moreover, public sector reforms and the restructuring and privatisation of the economy took time to be implemented. While the economy started to grow again in 1992 it was not until the end of the decade that GDP per capita growth really took off, and not until the financial crash of the late 2000s that the value of efforts to reduce public debt and cut long-term liabilities became evident.
Were there losers? And how was support for reform sustained?
There was considerable opposition at the start of the period to macroeconomic policies designed to get a grip on the currency, which precipitated a rapid upsurge in inflation (568% in 1990), as well as the privatisation programme. Tactical choices were made to keep the reform agenda on track. For example, the government loosened its restrictions on credit expansion in the second half of 1990, while holding firm on price liberalisation.
Key to ensuring changes were delivered was the decision to pursue multiple reforms simultaneously; there was a clear sense that the short-term pain induced by each individual policy would translate into political opposition, and that if reforms were pursued separately, the agenda as a whole would thus get stuck in the mud. By moving on a number of fronts at the same time, the Polish Government sought to imbed reforms fundamental to a healthy free market economy quickly, ride out opposition to the short-term costs, and achieve their objective of growth in the medium term.
However, the Government was also notably flexible, and did not seek to pursue all its desired reforms at once. Some, they were well-aware, would require more groundwork and preparation. This meant tactical trade-offs for strategic advantage.
This was certainly the case with privatisation, which was conducted more slowly and with more government direction than in other post-Soviet states. It was also the case with pension reforms. Vast swathes of the Polish labour force benefited from early retirement and generous pensions under the communist regime, but these carried with them immense liabilities for the public purse. While pension reforms were introduced in 1999, it was not until the 2010s that an increase in the retirement age – and the benefits this entailed for public expenditure – were secured because of high levels of opposition to the changes. It took on pension reforms slowly while making progress in other areas like healthcare and education.
Did the transformation involve a radical restructuring?
Yes. Poland moved from a centralised, command economy to a free market one in a very short timeframe. This involved a vast expansion of the private sector, at first through the creation of new private businesses, and later on through the privatisation of formerly state-owned enterprises. Prices and the currency were liberalised, SOEs were permitted to fail, and a wave of creative destruction was unleashed at the start of the 1990s.
There was also a restructuring of the labour market towards more productive employment, with the number of people employed in agricultural work as a percentage of the total workforce shrinking by almost half between the fall of communism and 2010, and the services sector expanding from 41.7% of the total to 56.6%.
Was there a sequencing of reforms and was this ideal?
Polish decision-makers were explicitly influenced by the German ordoliberals, and the policies of Erhard. To this end, they believed in the necessity of restoring the price mechanism and market signals and securing macroeconomic stability prior to further reforms. Only by achieving these objectives could the fundamental conditions for savings, investment and growth be created.
Did the transformation involve much higher savings ratios by households and/or the whole economy?
Poland’s economic transition at the outset was not straightforwardly about increasing the savings rate. The command economy of communist Poland, with its price controls and shortages, effectively forced households to save more: people held on to more cash than they would otherwise have done because they were unable to spend it. The reforms of the 1990s were about clearing this “monetary overhang” and unlocking spending. The savings rate accordingly plummeted in 1990, and consumption rose.
Longer term, however, the macroeconomic reforms were designed to restore confidence in the zloty and thus encourage savings and investment. This it achieved in the mid-1990s; Chart 2 and 3 show that the long term effect of Polish shock therapy was the recovery of savings rates, and the plateauing of consumption. Chart 4 shows the increase in investment – partly funded by domestic savings, partly by FDI. These trends were further supported by the shift in taxation away from income and towards consumption.
Was the transformation the work of one key person?
Lots of people were involved in Poland’s economic transformation. Donald Tusk played a key part in securing pension reforms, for example, while Grzegorz Kołodko was central to the improvement of the public finances in the late 1990s.
Moreover, Poland was greatly aided by its membership of the OECD which gave it access to the experience of the other member countries. It proved to be a good student.
It is hard, however, to think that Poland’s economic transformation could have been so complete without Leszek Balcerowicz as Finance Minister at the start of the period. It was his decision to capitalise on the unique political moment presented by the fall of communism and the economic crisis that followed in its wake, and to make a number of fundamental changes to the Polish economy simultaneously. Shock therapy was painful for Poland, and the recession that followed in its wake was longer than it might have been had a more gradualist approach been taken. Nevertheless, moving quickly prevented the reform programme from becoming bogged down and diluted through the political process.
Next chapterVI South Korea – Interventionism plus Competition: 1963-2007.
In many ways, the transformation of the South Korean economy is one of the most spectacular in recent world economic history. Not long after the Korean War, the CIA wrote off South Korea as a basket case. Indeed, in the early 1960s “it was close to being considered a failed state”107Douglas A. Irwin “From Hermit Kingdom to Miracle on the Han”, Peterson Institute for International Economics, 2021.. In 1960, its exports amounted to only about 1% of GDP and it was completely dependent upon US aid to enable it to pay for its imports, which were running at more like 10% of GDP.
Yet, in the space of a few decades, it went from being one of the world’s poorest countries to being one of the world’s richest. Moreover, it did this partly by means that the western conventional economic establishment opposed. 108See Joe Studwell, How Asia Works, London, 2014.
Asian development
Chart 1 and Table 1 give the history of South Korea’s growth performance. Despite two sharp economic contractions shown in the chart, every decade recorded in the table registered some spectacular growth rates.
If we look at the 24 year period from 1966 to 1990, South Korea’s GDP grew at an annual average rate of 8.5%. Average annual growth in the population of 1.7% means that this translates into average annual growth in real GDP per capita of 6.8%. Once account is taken of an increase in the labour force participation rate, this translates into an average annual increase in GDP per worker of 5.6%.109Alwyn Young “The Tyranny of Numbers: Confronting the Statistical Realities of the East Asian Growth Experience”, The Quarterly Journal of Economics, August 1995, pp. 641-680.
There are several spectacular aspects to this growth record. Between 1973 and 1979, the period dominated in the west by the ill-effects of the first oil price shock, Korea’s average annual growth was 9%. This compared with 8.4% for Taiwan and 5% for China. Between 1973 and 1978, the average annual growth rate of manufacturing in Korea was 24.7%.110Figures from Ha-Joon Chang, The Political Economy of industrial Policy, London, 1994. See also his Kicking Away the Ladder: Development Strategy in Historical Perspective, London, Anthem Press, 2003, and Bad Samaritans: The Guilty Secrets of Rich Nations and the Threat to Global Prosperity, London, 2008.
The Korean economist Ha-Joon Chang notes that the South Korea into which he was born in October 1963 was one of the poorest places on earth.111That said, its endowment of human capital was extremely high for its level of per capita income. See Dani Rodrik, “Getting Interventions Right: How South Korea and Taiwan Grew Rich”, Economic Policy, 1995, p55-107, and his “The New Global Economy and Developing Countries: Making Openness Work”, Policy Essay 24, Washington: Overseas Development Council, 1999. By 2007, its per capita income had grown by something like 14 times in purchasing power terms.112Chang, The Guilty Secrets of Rich Nations and the Threat to Global Prosperity, pp.3-4. He tells us that it took the UK over two centuries (from the late 18th century) to achieve the same result.
In 1965, manufacturing accounted for 18% of Korea’s GDP. By 1986 the figure had risen to 30%.
Korea belongs to a sub-set of east Asian rapid growers. Many people tend to think of all of these countries as part of the same development experience. But this is not true at all. They can be sub-divided into three separate groups:
- The city states of Hong Kong and Singapore;
- North-east Asia, consisting of Japan, Taiwan, South Korea and China;
- South-east Asia, consisting of Indonesia, Malaysia and Thailand.
Hong Kong and Singapore will be examined separately in this chapter but it is worth noting here what sets them apart from the other countries. Hong Kong was always much more free-wheeling than Singapore, in which the state played a much bigger role. But they both shared the same approach to international trade, namely a policy of pretty much completely free trade and the absence of capital controls. As we shall see, this is very different from other east Asian states. Moreover, as city states they faced different challenges and opportunities from the others.
The second group, which includes South Korea, operated a policy of trade protection, aimed at sheltering their “infant industries”. What distinguishes them from the third group is that they also believed in and practised competition between the protected domestic firms and sought to weed out the weak performers.
According to the development economist Joe Studwell, the members of this second group all followed a path which had first been mapped out by Japan, consisting of 3 key interventions:
- The maximisation of output from agriculture by focussing on labour-intensive household farming – which he calls a large-scale form of gardening;
- The direction of entrepreneurs and investment towards manufacturing and exporting;
- The direction of financial resources towards the finance of manufacturing and especially exporting, and curtailing the availability of finance for consumption and real estate.
Agriculture
In East Asia, land was very unequally held and peasants working the land for huge landowners typically had low productivity. The solution was radical land reform involving the forced redistribution of land, allowing peasants to farm smallholdings using mainly family labour, which was in abundant supply.
But to achieve this result required radical intervention by the state. In South Korea, after the end of the Korean war, the US pressurised the South Korean administration to enact a radical land reform programme.
Manufacturing
The key difference between the countries of north-east Asia and the countries of south-east Asia is the way that countries in the former group subjected their protected and subsidised manufacturers to export discipline. If they could not sell their wares in world markets then they were deemed not worthy of support. In South Korea, manufacturers had to report export numbers to the government every month and these figures would determine the firms’ access to bank credit. As Studwell puts it: “In Japan, Korea, Taiwan and China, the state did not so much pick winners as weed out losers.”113Studwell, How Asia Works, p62
According to Studwell: “ Korea became the most export-dependent developmental state the world had seen with the government giving subsidised credit to any firm that sold abroad. The interest rates paid by exporters ranged between a quarter and a half of the rate paid by everybody else.”114Ibid, p73 This meant that in periods of high inflation, exporters borrowed at between -10% and – 20 % in real terms.
South Korea’s chaebol, such as Samsung, Hyundai and Daewoo, were effectively compelled to export. As a result, Korea went from being the world’s 33rd leading exporter in 1965 to being the 13th twenty years later. (See Chart 2.) Even so, Korea posted its first trade surplus in only 1977. As Chart 3 and Table 2 show, since the late 1990s, South Korea has regularly run a current account surplus but the amounts have been comparatively modest, especially when compared with Hong Kong and Singapore.
As was true in other successful east Asian economies, vital decisions about government support were concentrated in a single government body. In Japan this was the Ministry of International Trade and industry (MITI). The Korean equivalent was the Economic Planning Board (EPB).
A key part of the purpose of protecting infant industries was the acquisition of know-how – learning by doing. Ha-Joon Chang has compared a developing country’s investment in industrial learning to parents’ investment in their children’s education.
The intellectual logic behind protectionism was mainly developed in Germany by followers of the so-called “Historical School”, the greatest member of which was probably Friedrich List. His views on economic development had a major impact in Japan and from there on the rest of East Asia. South Korean bureaucrats were heavy readers of the works of List. 115See his: The National System of Political Economy, Perth, Australia, 2022.
Finance
The third prong of Studwell’s development strategy was a very unorthodox approach to finance, in which the flow of funds must be state-directed. In South Korea it certainly was.
South Korea developed under a central bank that took its instructions directly from government. As Chart 4 shows, between 1960 and 1980, inflation was normally between 15% and 20% per annum and on two occasions it hit 30%.
As Chart 5 and Table 3 show, South Korea has posted some impressive rates of increase of personal consumption, consistent with its remarkable economic progress. South Korea initially had a low rate of household saving and funded its development partly by overseas borrowing.
And the economy was decidedly volatile, with periodic liquidity crises. The IMF had to intervene in 1971 and 1980-3, and again after the Asian financial crisis of 1997.
South Korea built up a large foreign debt but, unlike in the Philippines where a large build-up of debt under Ferdinand Marcos was splurged on unproductive uses, including real estate construction, in Korea this was used mainly to finance industrial development. When President Park died in 1979, the manufacturing sector had a debt to equity ratio of 488%.116Tibor Scitovsky, “Economic Development in Taiwan and South Korea” in Models of Development : A comparative Study of Economic Growth in South Korea and Taiwan, ed. Lawrence J. Lau, San Francisco, 1990, p 165. By 1985, South Korea was the second most internationally indebted country after Brazil, and with a much smaller population.
Like some other successful Asian countries, South Korea imposed strict capital controls which were only removed in 1993. (Japan had capital controls until 1980 and Taiwan until the late 1980s. China still has them.)
The Asian financial crisis of 1997 hit Korea very hard. Between 2 June 1997 and 24 March 1998, the exchange rate against the US$ fell by 36% and the stock market dropped by 34%. But South Korea had two advantages over most other Asian states. First, it had only liberalised the financial system, under pressure from the US and the international agencies, comparatively late in the development process. Second, as noted above, comparatively little of the money that flowed into the country was used to finance consumption splurges or real estate speculation. This meant that Korea was able to recover relatively fast from the recession that followed the financial crisis.
And there was a beneficial consequence. The crisis prompted intervention by the IMF and a financial reform programme that was now suited to Korea’s advanced stage of development. Many of Korea’s elite consider the 1997 crisis to have been a blessing in disguise. Because of the major changes in the political and economic regime that followed these events, 1997/8 can sensibly be regarded as a watershed moment in South Korea’s economic history.
Key aspects of Korean economic policy
South Korea’s growth involved very high rates of investment. To promote this objective the government was keen to run the economy hot. To maintain high investment rates, it deliberately operated a policy of suppressing consumption. Ha-Joon Chang says that “Korean macroeconomic policy may be more appropriately understood as “investment management” rather than as “aggregate-demand management”.117Tibor Scitovsky, “Economic Development in Taiwan and South Korea” in Models of Development : A Comparative Study of Economic Growth in South Korea and Taiwan, ed. Lawrence J. Lau, San Francisco, 1990, p165.
The Government sought to constrain consumption as a share of GDP in order to make room for investment. (See Chart 6.) And investment was indeed increased substantially from less than 10% of GDP in the early 1950s to more than 30% today. (See Table 4 and Chart 7.)
But this hasn’t meant that consumption has failed to increase. Far from it. Because the economy has grown rapidly, consumers’ expenditure has been able to increase substantially, even though it accounts for a much smaller share of GDP than it did during the 1950s, ‘60s and ’70s.
Interestingly, in complete opposition to some other countries’ approach in this area (notably Singapore), the South Korean government kept tight control over Foreign Direct Investment (FDI). Given a persistent savings gap, it tried as far as it could to use state guaranteed loans as a way of raising overseas finance, rather than FDI.
Strikingly, in view of the importance attached by most contemporary economists to achieving and maintaining low rates of price inflation, South Korea’s rapid expansion was accompanied by high rates of inflation. In the 1960s and 1970s, when per capita real incomes were growing by 7% per annum, the inflation rate was close to 20%. (See Chart 4.)
South Korea is not an economy with a low percentage of government spending in GDP, in the mould of Hong Kong and Singapore. As Table 5 shows, each decade has seen very substantial growth in real government spending, even in excess of the rapid growth of the economy. The result is, as Chart 8 shows, an increase in the share of government spending in GDP. Nevertheless, it is striking that during the period of rapid economic growth before the Asian financial crisis of 1997/8, government spending as a share of GDP was in the 20-25% range.
Correspondingly, government revenue as a share of GDP has also climbed, standing not far short of 40% in 2022. (See Chart 9.) Admittedly, tax revenue as a share of GDP was running at just over 18% in 2022 but this is misleading. Social contributions and other sources of revenue have become increasingly important. (See Chart 10.)
After running budget deficits in the 1970s, South Korea has since then tended to run surpluses, although again nowhere near the scale of those in Singapore or Hong Kong. (See Chart 11 and Table 6.)
South Korea’s economic growth rate has been bolstered by an impressive increase in the employment rate from well below 50% in 1960 to over 60% in 2022. (See Chart 12.) And the buoyant economy has kept unemployment generally pretty low. (See Chart 13.)
South Korea’s historical and cultural background has had a strong influence on economic development. It is sometimes argued that the absence of powerful classes has helped the state to be strong. In addition, the Confucian tradition helped the state to command the moral high ground and to draw the top talent into the bureaucracy. Moreover, the Korean War and the presence of a hostile regime just across the border helped to galvanise and unite the nation.
The free market fightback
Free market supporting economists have not taken the idea that the state has played a key role in South Korean development lying down. They have mustered a variety of arguments to support the power of markets over the state, even in the South Korean example. And a debate continues to rage in the academic literature about the efficacy and efficiency of the Korean Government’s industrial policy, which is usually considered alongside the equivalents in Japan and Taiwan.118There is a good summary of the debates between scholars on the effectiveness of industrial policy in Helen Shapiro, “ Industrial Policy and Growth”, DESA Working Paper no 53, August 2007. See also M. Nolan and H. Pack, “Industrial Policy in an Era of Globalization: Lessons from Asia”, Institute for International Economics, Washington, 2003.
First, many have emphasised that much of South Korea’s dynamism originated from a series of reforms enacted in 1965, including:
- The introduction of a unified, realistic exchange rate regime;
- Trade liberalisation, involving tariff reductions and the abolition of quantitative restrictions;
- Substantial increases in real interest rates.
Ha-Joon Chang, for one, is not persuaded that these changes were critical.119See Chang, The Political Economy of Industrial Policy. Arbitrary trade controls could still be imposed by the government. Meanwhile, South Korean saving had been rising even without the move to much higher interest rates.
Another argument concerns the so-called “virtual free trade regime”. The contention is that various forms of state intervention in South Korea cancelled each other out, so that the impact on the incentive structure was neutral.
A further argument is that Korea’s state intervention was prescriptive as opposed to the proscriptive form practised, for example, in India. According to the protagonists of this argument (the distinguished economist Jagdish Bhagwati being a leading one), prescriptive intervention allows the market to work outside the areas of prescription. It does not stifle growth.
Meanwhile, neo-classical economists could readily see the cosy relationship between the Chaebol and the government as being a negative factor, in particular making it difficult for new entrants to appear.
As it is, although the state was heavily involved in the economy, in the South Korean case it was not “picking winners”. Instead, it was guided by the market in the sense that it was those companies that succeeded competitively in export markets that received assistance in the form of subsidised funding.
The most persuasive neo-classical argument against the effectiveness of the Korean Government’s industrial policy is that the country’s undoubtedly impressive growth performance was due primarily to its very high rates of investment. Admittedly, in the early years the state had a major direct input into this by making significant investment in infrastructure. This created the conditions in which the private sector could profitably manufacture and export and encouraged it to invest with confidence.
Mind you, on their own, high rates of investment are not enough to secure rapid rates of economic growth. After all, the Soviet Union invested heavily but with woeful results.
The key person
The Korean experience provides another example of the importance of a key individual in the development process. The key person in South Korea’s economic development was General Park Chung Hee. None of the factors discussed above would have made much difference without the qualities of General Park who mobilised South Korea under the ideology of “Renaissance of the Nation”. Workers were described as “ industrial soldiers” fighting a war against poverty.120Ibid, p 126.
Park came to power in May 1961 through a coup. Twelve days later, Park and his colleagues started arresting and imprisoning leading businessmen. Before they were released they were required to sign an agreement which stated : “ I will donate all my property when the government requires it for national construction.” 121Studwell, How Asia Works, p 91. But when they were released, Park made it clear to the businessmen that as long as they stuck to the rules, they were free to make as much money as they could.
Support for Park was constrained by the fact that he had served under the Japanese colonial administration in Manchuria and accordingly was strongly influenced by Japanese ideas. (Japan was extremely unpopular in Korea because of its occupation and colonisation of the peninsula.) But he had also read widely and was familiar with German ideas on development, including those of Friedrich List, referred to earlier. His philosophy was that: “The economic planning or long-range development programme must not be allowed to stifle creativity or spontaneity of private enterprise.” 122Ibid, p76.
According to Studwell, “Each time the US, the World Bank and the IMF urged him (Park) to back away from his state-led industrial policy, he agreed – and then did precisely nothing (or occasionally a very little). Park was a leader of conviction, and his convictions were based in history.” 123Ibid, p78.
Park was able to draw support from the fact that South Koreans felt under physical threat from North Korea. Moreover, incredible though this seems to us now, in the early years South Korea faced a tough challenge to catch up with North Korea. The North had inherited much of the peninsula’s industrial base that had been established by the Japanese. And the North’s economy grew strongly in the 1950s and 1960s.124Gregory Noble “Industrial Policy in Key Developmental Sectors: South Korea versus Japan and Taiwan” in: Byung-Kook Kim & Ezra F. Vogel, The Park Chung Hee Era: The Transformation of South Korea, Cambridge , Mass., 2013.
General Park won three successive elections, albeit accompanied by election rigging and political dirty tricks. Half way through his third term as President, he dissolved parliament and established a rigged electoral system to grant him the presidency for life. He was assassinated in 1979.
During Park’s 18 years in power, South Korea’s GDP increased by a factor of 17; by contrast, during Mahathir’s 22 years in power in Malaysia, for example, that country’s GDP barely doubled.
Education
How far was Korea’s rapid development aided by its education system? The role of education in facilitating economic development is a controversial topic. The strongest evidence for a positive link concerns primary education which teaches children basic literacy and numeracy but even here the evidence is not overwhelming. In many developing countries, it may well be that causation runs in the opposite direction, that is, as countries develop and become richer, parents want their children to receive more education.
Studwell notes that Cuba has the second highest literacy rate for over 15s in the world yet the country is only 95th in the rankings of GDP per capita. (Studwell’s book was published in 2014.) The Soviet Union is another example of a country that produced large numbers of highly educated people but was unable to provide anything like enough suitable employment opportunities for them. So it was common to find highly educated people, even PhDs, doing menial jobs or driving taxis.
A key reason behind the apparent lack of connection between the amount of formal education and economic development is that most of the skills relevant to the development process are acquired within firms, rather than through formal education.
In 1950, literacy in South Korea was lower than in contemporary Ethiopia. We can safely conclude that at least in the early years, the characteristics of its formal education system contributed virtually nothing to South Korea’s rapid development.
However, in common with other rapidly growing East Asian countries, average educational attainments rose substantially during the whole period of rapid development. In 1966, only 26.5% of the working population had at least secondary education. By 1990, this figure had risen to 75%.125Alwyn Young “The Tyranny of Numbers: Confronting the Statistical Realities of the East Asian Growth Experience” in The Quarterly Journal of Economics, August 1995, p 642.
Until the 1970s, a high proportion of positions in the economic bureaucracy were taken by lawyers. And Chang (2008) tells us that: “The brains behind President Park’s Heavy and Chemical Industrialisation (HCI) programme in the 1970s, Oh Won-Chol, was an engineer.” He notes that in both Taiwan and China most economic bureaucrats have been engineers and scientists rather than economists. 126Chang, The Guilty Secrets of Rich Nations, p 217.
Relatively speaking, South Korea’s students were concentrated in engineering and science. By the 1990s, almost 40% of it students were studying in these fields.127M. Noland and H. Pack, ”Industrial Policy in an Era of Globalisation”, p 38-39.
Democracy
Democracy does not appear to be the essential prerequisite of economic success that so many people in the west believe it to be. Studwell says: “Democracy and authoritarianism….have not been consistent explanatory variables of economic development in east Asia.” (Studwell p. xxiv.)
He endorses the view of Amartya Sen that the question of whether democracy encourages or retards economic development makes a false dichotomy. “Democracy and institutional development are part of development and are not to be judged as drivers of it.” (Studwell p xxiv.)
Likewise, the rule of law. Western governments have tried to persuade the Chinese Communist Party that the rule of law is essential to economic development. But unfortunately the evidence for this proposition is mixed.
And, at least in its early development, the rule of law in South Korea was very flimsy indeed. At the behest of big business and with the connivance of the courts , the Korean police and the secret police intimidated, beat up and imprisoned union leaders and activists up to the 1990s.
Conclusions
The British development economist Ronald Dore once wrote about Japan at the height of its industrialisation: “ Left-wing … observers come back from Japan convinced they have seen a shining example of state planning. Right-wing visitors return full of praise for the virtues of Japan’s free enterprise system.” 128Ronald Dore, Flexible Rigidities: Industrial Policy and Structural Adjustment in the Japanese Economy 1979-1980 , London, 1984, p 27. The same thing could be said of Korea.
Arguably, the balance between the economic role of the state and the market should change over time. The efficiency issues which so obsess economists in the developed world are matters of importance for already developed economies. For developing economies, though, the position is often different. Investing in learning should come before worrying about efficiency.
At some point in a country’s development, it needs to make a switchover. South Korea seems to have been fortunate in that a switchover was effectively forced upon it by the Asian financial crisis of 1997. As in Japan and Taiwan, large Korean firms that had been nurtured by the state subsequently went on to campaign aggressively for deregulation.
Korea’s development story, like so many others, poses a challenge to rigid ideological positions in economics. Policy must adapt to the facts on the ground. As Studwell puts it: “When the state’s regulatory capacity is weak, it is sometimes easier for governments to pursue industrialisation objectives via state firms. Japan, Korea, Taiwan and China all made rapid technical progress using state owned companies.” 129Studwell, ,How Asia Works, p 130. The key requirements for this to work are export discipline and competition, rather than ownership.
Some of the opposition to the idea that state intervention in Korea had furthered its development came from the intellectual straitjacket imposed by neo-classical economics. But there was also a political element. South Korea’s rapid development occurred while the Cold War was in full swing. To many people it must have seemed like a betrayal of the west and its values to acknowledge that the market was not enough to bring development and that the state had played a key role.
Mind you, with the Cold War long over, this consideration does not apply now. Yet, even if it is acknowledged that the state did play a key role in South Korea’s development, the history and culture of South Korea make its case sui generis. Nevertheless, there are two key lessons here for other developing countries and for developed countries in the west trying to struggle out of economic torpor. First, is the emphasis on channelling funds to productive investment, rather than consumption or real estate speculation. Second is the emphasis on competition and being guided by the market in the allocation of finance.
Even so, heavy state intervention in the economy is one thing when the government has extensive powers outside the constraints of a normal western legal system; it is quite another in a western-style democracy.
As regards the future, the relative effectiveness of state involvement versus free markets pales into insignificance compared to something much more basic – demographics. Across East Asia, birth rates have fallen to very low levels but in late 2023, figures were released showing that South Korea’s birth rate had slumped to a new all-time low of 0.7 per woman, the lowest birth rate of any country in the world. Before long, this factor is going to shrink the workforce and place considerable burdens upon society in caring for the elderly.
Key Questions
In the introduction to this study, we posed a number of key questions about how economic transformation was achieved. This is how the answers stack up for South Korea.
Was there a plan?
In the case of South Korea there definitely was a plan conceived before the transformation process began. What’s more, the government intervened heavily in the economy and the financial system to fulfil this plan.
How long did it take for improvements to be clear?
After a boom associated with war expenditure in the early 1950s, there was a minor recession. Thereafter, real GDP per capita and real consumption per capita increased, although not at stellar rates. It wasn’t until the 1970s and 1980s that the country grew rapidly and living standards demonstrably improved by large amounts.
Were there losers? And how was support for reform sustained?
There were definite losers initially. But the economic growth rate was so rapid that most people could see their economic welfare benefiting. Nevertheless, there was decided opposition which the government cracked down upon strongly. This was not a normal western-style democracy.
Did the transformation involve a radical restructuring?
In the case of South Korea, transformation did involve a fundamental restructuring such that the economic make-up of the country was barely recognisable by the end of the programme.
Was there a sequencing of reforms and was this ideal?
The redistribution of land and the drive towards increased agricultural yields came early on. Later, it was the deliberate policy of the Park government not to operate a liberalised economic and financial system and to give overwhelming precedence to investment and exports. It was only after the financial crisis of 1997 that the economy was liberalised. By this stage, South Korea was already well down the development path.
Did the transformation involve much higher savings ratios by households and/or the whole economy?
South Korea’s transformation involved heavy rates of investment. To finance this spending, the government restricted the availability of finance for consumption. Even so, in the early years the country ran substantial current account deficits for a considerable period so that, at this stage of its development, the financing for a good deal of its investment came from overseas.
Was the transformation the work of one key person?
Perhaps more than in any other of the countries studied here, South Korea’s economic transformation was indeed overwhelmingly the work of a single person – General Park. Having said that, after he was assassinated in 1979, economic growth continued at impressive rates.
Next chapterVII Hong Kong – The Free Market Rules: 1962-1988.
At least until the last few years as China has asserted increased control over the territory, we have been inclined to see Hong Kong as an extraordinary success story. But it hasn’t always been like that. Before the Second World War, Hong Kong was a comparatively sleepy outpost of the British Empire. Japanese occupation during the war had a devastating effect as the invaders stole much of value and the population fell from about 1.5 million before the war to about 600,000. When the British returned after the war, they faced a difficult task in restoring the economy to normal but in the succeeding decades the growth rate of the economy and of living standards was phenomenal. 130In this section, as well as official statistics and other sources, we have drawn on two books by Neil Monnery, Architect of Prosperity, London, 2017, and A Tale of Two Economies, London, 2019.
We can say that Hong Kong’s transformation starts immediately after the war but the absence of adequate statistics in the early post-war years makes analysis difficult. Most statistical series begin in 1960. Because of recent political changes in Hong Kong and the stance of Chinese policy towards it, Hong Kong is not the place it once was. You could say that it might be sensible to finish our examination of Hong Kong’s period of spectacular performance in 1997 when the territory was handed over to China. In practice, though, this would not be appropriate because at first not a great deal changed. So our discussion and examination of performance continues after the handover.
We will go into detail about Hong Kong’s economic performance later, but a brief overview is helpful now. Putting it mildly, Hong Kong’s economic record is impressive. From 1966 to 1991, Hong Kong’s average real economic growth rate was 7.3%. Population growth of 1.6% per annum reduces this to 5.7% for the growth of real GDP per capita, and an increase in the labour force participation rate reduces the growth in GDP per worker to 4.7%. Nevertheless, this is a stellar performance.
Hong Kong’s peculiarities
There is no doubt that Hong Kong’s situation was and is extraordinary, but most of its natural features must count as disadvantages rather than advantages:
- It has virtually no natural resources, apart from its fine harbour.
- it has very little agricultural land.
- It has limited supplies of water and often has to import large amounts of this vital commodity.
- It has a small land area of only a little over 430 square miles, and yet supports a population of 7.4 million people. (This compares with Greater London with about 40% more land supporting a population 20% higher. The Netherlands supports a population roughly 2.3 times that of Hong Kong but with over 30 times the amount of space.)
Having said that, some commentators have attributed Hong Kong’s success at least partly to some extraordinary features of its politico/demographic situation:
- A large inflow of motivated workers, including some existing or budding entrepreneurs, escaping from Communist China, who moved their capital equipment and themselves from the mainland, especially Shanghai.
- A system of government as a British colony that allowed the pursuit of a consistent, long-term focused, economic policy over several decades.
- An effective collaboration between Chinese business culture and British governance. Hong Kong’s industrialisation after the war was driven by Chinese families “using their own funds and investing their retained profits”. 131Monnery, Architect of Prosperity.
- Its location with a fine harbour and a developed financial system enabled it to act as a port and a financial hub for South China as it developed rapidly after 1978.
- Given its small size, anywhere in the territory is no more than an hour’s commute away.
A very distinctive economic policy
Although there may be something in these points, at least as a counterweight to the territory’s natural disadvantages, during its long post-war success, Hong Kong followed a very distinctive set of economic policies. It is difficult to escape the conclusion that these policies are at the root of its success. The main features of its regime have been:
- It has operated a currency board, under which the Hong Kong dollar is pegged to the US dollar into which it is freely exchangeable. The currency is fully backed by official holdings of US dollars. Accordingly, the Hong Kong Monetary Authority has had no scope to operate an independent monetary policy. Its official interest rates are effectively set by the US Federal Reserve.
- Very low tax rates. Income tax was originally levied at a flat rate of 10% but this was increased to 12.5% and then to 15 % in 1966, where it remains today. There are no sales taxes and very limited duties. Corporation tax is levied at 17%. Even so, taxes paid by corporations account for about 40% of all tax revenues, roughly double the amount paid by individuals.
- Total tax revenues as a share of GDP have run at very low levels.
- Underpinning this low tax regime, government spending has been very low as a percentage of GDP, with government final spending, i.e. excluding transfers, running at about 15%.
- The tax code is relatively simple and easy to understand.
- There is great stability in the tax regime, allowing businesses and individuals to plan effectively.
- In normal years, the government aims to run a budget surplus. As a result, there is no public debt. On the contrary, the government has a reserve fund which enables it to avoid bouts of austerity if, for some reason, tax revenues should falter. (The aim has been to keep the equivalent of one year’s spending as a cash reserve.) And the income on the government’s stock of assets has enabled it to run with a lower rate of taxation for any given level of government spending.
- It has operated a policy of completely free trade, with zero tariffs and complete freedom of movement of goods, services and capital. In the past, when other countries have imposed tariffs on exports from Hong Kong, it has refrained from retaliating. Hong Kong is just about the most open economy in the world with exports and imports running at about 200% of GDP.
- One area of the economy where the government looms large is housing. About a half of the population lives in government-built apartment blocks. About one third of the population rents this public housing at affordable rents, with the rest having bought their housing units at subsidised prices. Yet The Hong Kong Government manages to do this without incurring losses.
One man’s special contribution
The essence of this distinctive economic policy was developed by a group of British civil servants, seconded to Hong Kong, operating with full support from the Governor of the colony. But one remarkable British civil servant, Sir John Cowperthwaite, stands out. He served in the colony from 1945 and was Financial Secretary, i.e. running economic policy, from 1961 to 1971. The same broad policies were followed by his successors.
Cowperthwaite was an unapologetic student and follower of the classical economists, especially Adam Smith. Throughout his time in Hong Kong, he repeatedly fought off attempts to increase the remit of government in one way or another. (During the late 1940s the Governor of Hong Kong had to fight off pressure from the British government to increase Hong Kong’s rate of income tax from 10% to 25% because under the Attlee government, British tax rates were much higher, with a standard rate of 45% and a top rate of 92.5%. Cowperthwaite increased Hong Kong’s rate to 15% in 1966.)
Interestingly, despite Hong Kong’s staggering success, Cowperthwaite was treated by the British economic establishment with a certain disdain since he was so out of line with the contemporary economic consensus. At no stage, so it appears, did they think that perhaps they had something to learn from this extraordinary Scotsman.
It isn’t that he believed in merely a “nightwatchman” state. He approved of various types of public expenditure, including on education and public infrastructure. He was clear that government had to have a major role in the supply of water, for instance. On education he said: “ I regard education as a good thing. But we must still ask what a good thing costs, how much of it we can afford and who is going to pay for it.” 132Ibid. He even supported some forms of welfare. But he was more concerned to keep the economy growing and he argued that from this growth, higher levels of government spending on social programmes would follow.
Experience has borne out his judgment. From 1960 to 2019, there has been a 20 fold increase in real government spending per person.
In particular, he opposed the adoption of any sort of” Industrial Strategy”, except the Smithian one of letting the market decide. In this sense, Hong Kong’s success was not the outcome of some pre-ordained government plan. The strategy was not to have a plan at all.
And Cowperthwaite was unfazed by bankruptcies and insolvencies, believing in the Schumpeterian dictum of “creative destruction”. Indeed, the industrial structure of the territory underwent huge changes in response to international trading patterns and the evolution of Hong Kong’s own comparative advantage. It started out heavily dependent upon the entrepôt trade with China. When this dried up after the Communist takeover in 1949, textiles became the dominant sector, followed by plastics, electronic goods and subsequently a move into financial services and tourism. Today financial services account for just under a fifth of the economy.
During its textile phase, there was much consternation in both Britain and the US that Hong Kong could produce textiles so cheaply. This led to suggestions that Hong Kong manufacturers were selling below cost or were recipients of substantial subsidies. In fact, neither of these was true. Rather, manufacturers in Hong Kong had installed modern equipment, used it more intensively, often running three round-the-clock shifts, and thereby, unsurprisingly, had lower unit labour costs.
At least initially, Cowperthwaite took the same laissez-faire attitude to banking as to other sorts of economic activity. After experiencing more than one banking crisis, however, he had to learn that banking and finance are different and they need to be closely regulated.
An unusual system of government
Throughout its period of great economic success, Hong Kong was a British colony. This makes a striking contrast with most of the British Empire which, following India in 1947, rushed to independence in the 1950s and ‘60s.
Accordingly, Hong Kong was no democracy in the “ballot box” sense. Its British-appointed Governor exercised wide powers, both creating laws and enforcing them without having to submit to anything resembling general elections. The Governor was advised by a “Legislative Council” and, as its name suggests, this was the body that formally passed legislation. But most of its members were civil servants appointed by the Governor and even the others were appointed and not elected.
Nevertheless, other key elements of normally functioning democracies were present:
- The rule of law was followed thoroughly and everyone was equal under the law;
- Property rights were respected;
- Contracts were fully enforced;
- There was very little corruption;
- There was a free press and freedom of speech.
Moreover, despite the Governor having near-absolute powers, in practice the administration was keen to explain its decisions and to be seen to be both fair and efficient. Evidently, it wanted, as far as possible, to be governing with consent.
In the efficient running of the government, the role of the civil service was critical. As Monnery puts it: “ The success or failure of the model relied heavily on the colony’s professional cadre of civil servants, and Hong Kong was fortunate in recruiting and retaining a group of mostly capable, honest, hard-working, dedicated and thoughtful individuals”. 133Ibid, p 2.
These civil servants were so-called cadets. The name belied the fact that they were a high-flying elite. Sir John Cowperthwaite himself was intellectually distinguished, having two first class degrees in classics and a first class degree in economics and political science.
In view of continuing debates about the competence of senior British civil servants and the way that they are rewarded and incentivised, it is striking that Sir John was generously rewarded, not so much in his salary – although that was generous enough – but in his other perks, including a generous holiday allowance, an excellent pension and very comfortable accommodation. But it is also noteworthy that he had a decidedly frugal side which doubtless played well in PR terms. He once declined the offer of air conditioning on the grounds that this was not available to ordinary Hong Kong citizens.134Ibid, p145.
The scale of Hong Kong’s economic achievements
The scale of Hong Kong’s economic achievements is plainly visible in Charts 1-3. Chart 1 shows Hong Kong’s GDP per capita compared to the equivalent in the UK and the US. In 1950, Hong Kong’s per capita GDP was 37% of the UK’s and 27% of the US’ per capita GDP. Now Hong Kong’s per capita GDP is about 83% of the US’ and 27% higher than the UK’s.
Charts 2 and 3 put this achievement in an international and historical perspective. Chart 2 shows how long different countries took to progress from a real per capita GDP of $4,000 to $10,000. Starting in 1835, it took Britain 100 years to achieve this transformation. It took Hong Kong only twenty years.
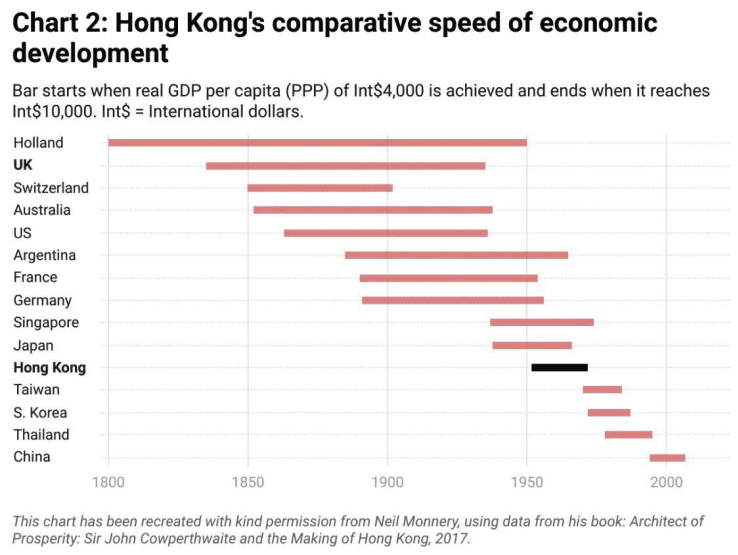
Chart 3 is constructed on the same basis but it measures how long it took to move from a GDP per capita of $10,000 to one of $40,000. This took Hong Kong only 35 years. By contrast, it took Switzerland more than 100 years to achieve this.
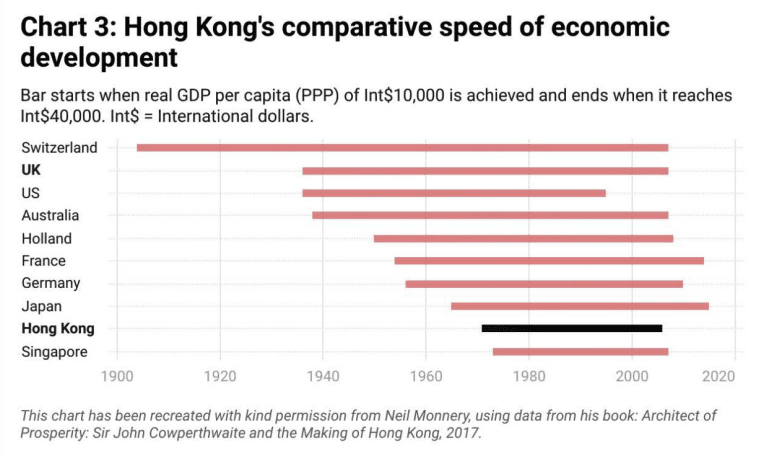
We hear a lot about rapidly growing countries in Asia being able to grow so fast because they were catching up with richer and more developed countries in the west. There is much in this. But such is the scale of Hong Kong’s achievement that it has continued to outgrow countries like France, Germany and the UK even after it surpassed their levels of GDP per capita. It is now they who should be catching up with it.
Table 1 gives the figures for Hong Kong’s growth rate, both for overall GDP and GDP per capita, in decade averages. It is striking that Hong Kong’s fastest growth decade, both for overall GDP and GDP per capita, was the 1970s, the decade that many countries in the world regarded as disastrous. And growth continued at only marginally lower rates in the 1980s, before settling down to much lower rates in 2010-2019.
Some critics question whether these figures for GDP per capita give a fair picture of what has happened to the average standard of living of Hong Kong’s population. Hong Kong is not in the same position as Ireland, where real GDP per capita is substantially higher than real GNI per capita because of the huge remittances of profits abroad by multinational companies with substantial operations in Ireland. In Hong Kong, by contrast, GNI per capita is actually higher than GDP per capita, reflecting Hong Kong’s very substantial overseas investments.
Nevertheless, the fact of Hong Kong’s very large current account surplus plus a high rate of investment implies that its per capita consumption is a good deal lower than its GDP per capita would lead you to expect.
Even so, a survey from 2013 of average household income in Hong Kong put it higher than the equivalent in Singapore, Germany, the UK and France.
Similarly, a World Bank comparison for 2017 put Hong Kong’s consumption per capita above the equivalent in all 24 other developed countries except the United States.
Table 2 gives the equivalent figures for the growth of real consumer spending to Table 1’s figures for GDP. Unsurprisingly, these consumption figures broadly mirror the GDP figures, although in 2010-2019, the growth of consumer spending outstripped that of GDP. This was reflected in a rise in the share of consumers’ expenditure in GDP, as shown in Chart 4. Simultaneously, there was slight drop in the share of GDP accounted for by Gross Fixed Capital Formation (investment), shown in Chart 5.
Throughout the period examined, both Hong Kong’s exports and her imports grew at very high rates, as shown in Tables 3 and 4. Exports usually comfortably exceeded imports, helping to sustain a substantial current account surplus, as shown in Chart 6 and Table 5.
But, as Chart 7 makes clear, the trade balance was not the only major factor contributing to a current account surplus. Hong Kong has enjoyed a substantial net investment income, reflecting the surpluses of previous years, well invested. As the chart shows, in recent years this net investment income has exceeded the trade surplus. (The “other” category shown in the chart, which has been negative, mainly reflects remittances abroad from income earned in Hong Kong by foreign nationals.)
Unsurprisingly given this economic strength and dynamism, the labour market has generally been strong, with the working population as a share of the total population rising impressively since 1960. (See Chart 8.) And unemployment has generally remained low, as shown in Chart 9.
The fiscal position has been extraordinary. Tax revenues have risen rapidly, as Table 6 shows. And Chart 10 shows tax revenues gradually rising as a share of GDP, but still remaining remarkably low by the standards of most other countries. Government spending has also been on a rising trend, even before Covid hit, as Chart 11 and Table 7 show, although it is still very low by the standards of most other countries.
Table 7 presents a striking comparison with the UK and stands as a testament to what rapid economic growth can do. Hong Kong has a reputation as being the home of red-blooded capitalism, and was strongly endorsed by none other than Milton Friedman. It does have a lower share of government spending in GDP than the UK. Yet, because of the rapid growth of her economy, in every decade since the 1960s, Hong Kong’s government spending has increased by far more than the UK’s, and sometimes the difference has been very large.
On the face of it, there seems to be a surprising discrepancy between the share of GDP taken in tax revenues and the share going on government spending. As Chart 12 shows, this surprising feature is accounted for by the fact that a substantial proportion of Hong Kong’s government revenue comes from non-tax sources – “funds” and the income on investments.
There are several government-owned funds, including the lotteries fund, run by the Hong Kong Jockey Club, which takes revenue from the sale of lottery tickets. But by far the largest of the funds is the “Capital Works Fund”, which finances infrastructure, public works and land acquisition. Its revenue comes from a land premium paid on property transactions. In 2022, this Capital Works Fund accounted for 90% of total fund revenues.
Income from the funds and from investments transforms the government’s fiscal position. In 2019, for instance, the last year before the pandemic, tax revenues amounted to only 13.7% of GDP, whereas total government revenues, including the income from funds and investments, were over 21% of GDP. This amounts to a substantial dividend from past fiscal probity and it marks a sharp contrast with most western countries where debt interest accounts for a very substantial proportion of government spending.
Table 8 and Chart 13 show the origins of this bounty. The government budget balance has usually been a surplus, until Covid recently knocked things for six. The result has been that, whereas most governments are burdened with substantial debts, as Chart 14 shows, the Hong Kong government benefits from a substantial holding of assets.
Chart 15 shows that in recent years this record of economic success has not been accompanied by high rates of inflation. In fact, the opposite. Inflation did run at rates close to, or even sometimes over, 10% during the 1980s and 1990s and even higher at points in the 1970s. But after 2000, the rate subsided markedly.
One of the most remarkable aspects of Hong Kong’s achievements is the dramatically changed industrial structure, as Chart 16 makes clear. In the mid 1970s, manufacturing accounted for almost 30% of GDP. These days the share is down to about 1%, as manufacturing has shifted to places in mainland China where labour costs are much lower. Hong Kong has developed into a sophisticated centre for all sorts of international services. As the chart makes clear, this makes a vivid contrast with Singapore, where the government has sought to maintain a large manufacturing sector.
As you would expect, the record of stellar economic success has been accompanied by rapid improvements in all the usual social indicators of a developed economy. For instance, the percentage of the population with at least secondary education increased from 27.2% in 1966 to 71.4% in 1991.135Alwyn Young, “The Tyranny of Numbers”, Quarterly Journal of Economics, 1995, pp 641-680.
There is one blot on the scoresheet. The distribution of income in Hong Kong is pretty unequal by most modern standards. In Hong Kong the ratio of the earnings of the 10% highest paid to the 10% lowest paid 10% is almost 18. This is similar to the ratio in Singapore but the comparable figures for the US and the UK are 16 and 14 respectively. For 2016, the internationally recognised metric of inequality, the Gini coefficient, showed Hong Kong at 0.59, just above the US at 0.58 and well above Germany at 0.50, the UK at 0.47 and France at 0.43.
On this subject of distribution, Cowperthwaite said:
“I myself have no doubt in the past tended to appear to many to be more concerned with the creation of wealth than with its distribution. I must confess that there is a degree of truth in this..”136Quoted in Monnery, Architect of Prosperity, p 78.
He went on to say that rapid growth raised all incomes.
Answers to key questions
At the beginning of this study, we set out certain key questions about a country’s transformation/take-off. We are now in a position to answer these for Hong Kong, as follows.
Was there a government plan for economic transformation?
There was no pre-envisaged plan for the development of Hong Kong. But there was a clear strategy, namely to leave just about everything to the free market, keeping tax rates low and running budget surpluses, allowing the state to build up a large fund of assets which, well invested, produced a substantial flow of revenue over and above the revenue from taxes.
How long did it take before major advances were discernible?
There was a pretty much continuous process of improvement in the economy, rather than an initial period of “ sacrifice” and loss which was vindicated and offset later.
Did economic transformation create losers and, if so, how was political support maintained?
There wasn’t a substantial body of losers during Hong Kong’s economic ascent. That doubtless limited opposition to what was happening. Also, as a British colony there weren’t the usual political pressures that might cause problems for a government in a normal western democracy. This was particularly helpful in allowing the processes of creative destruction to operate and for the country’s economic structure to go through radical changes in keeping with its changing comparative advantage.
Did economic transformation involve a complete restructuring of the economy?
Economic development in Hong Kong did involve a major restructuring of the economy as a result of increased skills, capital and sophistication such that the things from which Hong Kong derives its living are very different today from what they were in the 1950s. As noted above, the share of manufacturing in the economy has fallen from almost 30% to about 1%.
What was the sequencing of policy changes?
There was no sequencing issue because from the start, the essential principle was to let the market decide. Any sequence emerged naturally as a result of market developments. Hong Kong’s success derived from doing a wide range of things well, and doing them better than Hong Kong’s competitors. But all of these improvements evolved from the central principle of letting the market have its head.
Did the period of transformation involve high savings rates by households and/or the whole economy?
Throughout its period of rapid development, both personal and national savings rates were high. The Government was normally a net saver and the country usually ran a current account surplus.
To what extent was the transformation the work of one key person?
Hong Kong’s success was associated principally with the role and influence of one person, namely Sir John Cowperthwaite. Nevertheless, his principles and beliefs were widely shared among the civil service elite.
Lessons for the UK?
Hong Kong’s achievements are staggering. What are the arguments for ignoring this experience when thinking about economic policy in a country like the UK? There are four:
- Hong Kong’s success derives from its peculiar situation, geographically, politically, historically and culturally. Its formula simply could not be replicated in a country like the UK, or if it could, it would not be as successful.
- Even if similar policies would bring equivalent success, it would be impossible to implement such a policy programme because the UK is a democracy and Hong Kong was not, and still isn’t one today. The need to gain electoral support in a country like Britain would make the approach to economic policy followed by Hong Kong unachievable, or at least unsustainable.
- Even if a policy regime like the one operated successfully by Hong Kong was politically feasible in the UK, its successful implementation would depend upon a degree of competence, motivation, determination and responsiveness in the civil service which is simply not present.
- Even if it were achievable, and even if it resulted in decidedly higher rates of economic growth, such a policy regime would not be desirable because of its implications for the distribution of income and wealth.
We will evaluate the strength of these arguments in the concluding section of our Policy Programme for Prosperity.
Next chapterVIII Singapore – Capitalism with Socialist Characteristics: 1959-2007.
Formerly a British crown colony which was granted self-government in 1959, Singapore joined the Federation of Malaysia in 1963. But this union lasted only two years amidst damaging ethnic tensions. Singapore split from Malaysia in August 1965. Singapore’s Prime Minister, Lee Kwan Yew, said that Singapore had been “turfed out”.
As Lee wrote in his memoirs “The Singapore Story”:
“We had been asked to leave Malaysia and go our own way with no signposts to our next destination. We faced tremendous odds with an improbable chance of survival … On that 9th day of August 1965, I started out with great trepidation on a journey along an unmarked road to an unknown destination.”137The original edition of the memoirs under the title The Singapore Story was published in 1998 by Times Editions Pte Ltd in Singapore. A subsequent, updated edition of the memoirs under the title “From Third World to First” was published in 2000. This quote is taken from the 2000 edition, p 19.
At that point, doubtless Singapore’s prospects must have seemed dim. Nevertheless, it suited Lee and his senior colleagues in the governing party (the People’s Action Party, or PAP) to portray this starting point as thoroughly desperate, in order to make the subsequent success all the more remarkable. But in fact, Singapore had developed rapidly before the Second World War and this continued afterwards. In 1965, Singapore had a per capita income about 2.5 times that of Malaysia and 10 times that of Indonesia. 138Henri Ghesquiere, Singapore’s Success: Engineering Economic Growth, Singapore, 2007, p 43. For an account of Singapore’s earlier development read: W.G. Huff, The Economic Growth of Singapore, Cambridge, 1994..
Yet this is not to belittle the scope and scale of Lee’s subsequent achievements. When Lee started on his journey, Singapore was plagued by high unemployment and considerable labour unrest, much of it stirred up by the local Communist Party, which enjoyed considerable public sympathy. Lee Kwan Yew said: “Until 1962, Singapore had endless strikes. By 1969, there were none.” 139Lee, The Singapore Story, p 103.
One of the major labour market difficulties that Singapore faced in the early years was the rundown of Britain’s military presence. As Lee records in his memoirs, before the rundown, British military spending accounted for about 20% of Singapore’s GDP and provided employment for more than 10% of the workforce. 140Times Editions Pte Ltd, Singapore,1998, p23
Moreover, Singapore was surrounded by unfriendly states, both Malaysia from which it had just split and Indonesia. Even after using land reclamation schemes to expand its land area by over 20% between 1959 and 2016, it is still a small (less than 800 km2) tropical island with no natural resources except its prime position in the shipping lanes.
You could argue that Singapore’s very compactness conferred advantages – low unit costs for the construction of utilities and infrastructure and the absence of regional unemployment. All workers can easily travel to all parts of the territory pretty quickly and cheaply. But by no means all small sovereign territories achieve what Singapore has. Many Caribbean islands readily spring to mind.
And Singapore has had acute ethnic difficulties to deal with. Although a majority of Singaporeans are of Chinese ethnicity, the country has considerable numbers of people of Malay, Indian and Sri Lankan heritage. On top of this, it is now home to a very large number of non-Singaporean workers. Accordingly, it has faced a major challenge to keep ethnic tensions in check and to forge a multi-ethnic, Singaporean identity.141There is an excellent account of Singapore’s history, both ancient and modern, in John Curtis Perry’s Singapore: Unlikely Power, New York, 2017.
As regards its success in overcoming these challenges, the numbers speak for themselves. At the time of independence, Singapore was a poor country. Table 1 shows that in each decade it has enjoyed spectacular economic success. In the 1970s its average growth rate was just over 9%, and 7.5% in per capita terms.
From 1960 to 2022, its per capita GDP increased by nearly 1800%. This compares with just over 200% for the UK and the US, about 250% for France and Italy, nearly 350% for Spain and 475% for Japan. Singapore now has the fourth highest GDP per capita in the world.
These GDP figures, however, need some qualification. As with Ireland, Singapore’s GNP per capita is below the figures for GDP per capita, reflecting substantial remittances abroad of profits by multinational companies with large operations in Singapore. In 2022, real GDP per capita was almost 20% higher than real GNP per capita. This gap is not insignificant but it doesn’t appreciably alter the picture given by the GDP figures.
Singapore’s economic success has shown up in all the usual indicators of health. Life expectancy has risen dramatically and the infant mortality rate has fallen to one of the lowest levels in the world.
How on earth did Singapore manage this?
Policies for success
Singapore is sometimes dismissed as an offshore financial centre of little relevance to other countries – a sort of Asian Switzerland. This is grossly inaccurate. For a start, after independence, the initial drive was to industrialise. In the first few decades, manufacturing was the big employer. Strikingly, manufacturing still accounts for about 20% of GDP. As Chart 1 shows, this is in striking contrast to Hong Kong where the share of manufacturing in GDP has fallen precipitately
Within that sector things have changed dramatically as Singapore has moved up the value added chain. Early on it was a leading manufacturer of textiles and clothing. Now it is a leading manufacturer of electronic and medical equipment, amongst other things.
It does have a large financial sector, but it also has a strong tourism business and it is still a thriving port and shipping centre.
Its industrial mix does not disqualify Singapore as a possible source of lessons for the rest of the world. But what positively qualifies it as a source of lessons is the extraordinarily important role that policy has played in its success.
Government intervention and the markets
There was never an over-arching plan as such but the government had a clear set of values that did not change. According to Henri Ghesquiere: “It planned the country’s long term development as if it were a corporation.” 142Ghesquiere, Singapore’s Success, p.92. One prominent Chinese visitor in 2010 described the approach, using an old Chinese metaphor, as: “ crossing the river by feeling the stones.”143Perry, Singapore: Unlikely Power, p 240.
The government embraced market forces and competition and imposed very light duties on trade and next to no non-tariff barriers. Nevertheless, the Singaporean state was strong and intervened heavily in selected areas. It has strong positions in the production of goods and services and it subsidises basic healthcare, education and home-ownership, evidently because it believes that these confer significant favourable externalities.
In particular, it invested heavily in public housing. In 2016, some 82% of its people lived in publicly constructed housing, compared with 9% in 1959. The housing may have been publicly built but with the help of government subsidies, most of it is privately owned. The home ownership rate runs at 93%.144Ghesquiere, Singapore’s Success, p 17.
The government and its agencies own about 90% of the land in Singapore. The state has the power to acquire land for public purposes at its value on an earlier date. It leases this land to the private sector for periods of up to 99 years. The revenue from these leases is very considerable. It allows taxes to be much lower than they would otherwise be. The philosophy behind this approach to land ownership is that private landlords should not be allowed to profit from an increase in land values brought about by economic development. (This echoes the views of the American political economist Henry George.)
Macro policy
Monetary policy has always been conservative. Chart 2 shows that although inflation has been quite volatile, it has remained pretty low, averaging 2.5% from 1961 to 2022. This is slightly lower than the figure for Germany and Japan, and substantially lower than the inflation figures in other industrialised countries. Over this period, inflation in the UK averaged 5.2%.
The Monetary Authority of Singapore (MAS) has been helped by the lack of wage militancy. In 1972, the tripartite National Wages Council was established by the government to set non-mandatory wage guidelines. They seem to have been broadly upheld.
From 1981, monetary policy has been focussed on the exchange rate. The currency floats within an undisclosed band. The policy has been to let the Singapore dollar move up in nominal terms to offset any inflationary influences coming in from abroad. The real effective exchange rate has been broadly stable. (See Chart 3.)
Unlike some other Asian countries, Singapore has always been conservative financially. It has typically run a budget surplus. (See Chart 4.)
The government has no external debt and its domestic debt is there only to provide a benchmark for domestic capital markets. In marked contrast to most governments, instead of debt, the Singapore government holds very substantial assets. The exact total is a state secret but informed estimates put it at about 100% of GDP.
From the beginning, the government has placed considerable importance on saving. A prominent role has been played by the Central Provident Fund, first established by the post-war colonial government. This is a compulsory scheme of saving for retirement. Both employees and employers are obliged to contribute, at times as much as 25% of pay each. From 1968, people were allowed to withdraw money from the Fund to finance specifically sanctioned forms of expenditure: to buy a property, fund education or pay for healthcare.
Linked to high personal saving and other aspects of the macro economy, principally the huge current account surplus), the share of GDP devoted to personal consumption has fallen dramatically over recent decades. (See Chart 5.)
On top of high personal saving, there has been considerable saving by government and companies. The result is a very high rate of national savings which at times has exceeded 50%. Simultaneously, domestic capital formation (fixed investment) has been extremely high, although as a share of GDP, it has fallen back over recent years.(See Chart 6.)
In its early years, Singapore’s domestic investment exceeded its savings so it had to bring in substantial amounts of capital from abroad. This implied running a current account deficit (matched by a capital account surplus). Accordingly, by 1985 it had built up a substantial net negative balance of foreign assets. But Singapore did not borrow abroad for consumption purposes. Most of the capital inflow represented inward FDI by multinational companies which served to boost Singapore’s export capacity.
Subsequently, the savings rate rose and the investment rate fell, to the point where Singapore ran a sizeable current account surplus, enabling it to send huge amounts of capital abroad. In 2005, its annual current account surplus peaked at almost 30% of GDP. Over the three years 2020-2022, the surplus averaged about 18% of GDP. (See Chart 7 and Table 2.) Both exports and imports run at over 140% of GDP. (See Chart 8.)
For twenty years before the covid-induced spike in 2020-21, for most years, total current government expenditure was between 10% and 15% of GDP. The average over 2000-2019 inclusive was 13.4%. (See Chart 9.) This compares with 39.5% for the UK, 45.8% for Germany, 54.9% for France, 48.6% for Italy, 42.1% for Spain and 36.3% for Japan.
Since 1975, tax revenue as a share of GDP has varied between 11.5% and 19%. Over the last fifteen years it has averaged 13.5%. (See Chart 10.) Overall government revenues have been consistently higher than this by a good 50%, reflecting property income, revenues from the lease of land, user fees imposed on car usage and income from the government’s investments. Even so, the share of all government revenues in GDP is still strikingly low. (See Table 3.)
Mind you, when contemplating these striking figures, a word of warning is in order. International comparison of government spending and tax rates is complicated by the fact that many services in western countries that are financed out of general taxation in Singapore are financed through the Central Provident Fund, contributions to which are compulsory.
Micro
The government has been assiduous in trying to prevent Singapore’s tiny territory from becoming permanently gridlocked with traffic. Through imposing tariffs and other measures, including limiting the number of licenses for car ownership and auctioning them to the highest bidders, it has deliberately made car ownership extremely expensive.
More importantly, in 1975 the government introduced a system of road pricing in order to minimise congestion in what is a small, crowded island. Nowadays, overhead gantries scan and automatically deduct a toll from a cash card unit installed in each car. Charges vary according to the time, place and class of vehicle. Revenue from vehicle-related taxes amount to about 3% of GDP.
Another area of achievement is the law. Before 1990 congestion in the courts had cause delays that sometimes stretched to 4-6 years. But a new Chief Justice appointed in 1990 reformed the courts and their procedures. By 1999, the court system had come to be highly regarded internationally for speed, efficiency, low cost and fairness. In these respects, international rating systems put Singapore ahead of the US and the UK.
And Singapore has used some of its weaknesses to develop technological expertise. One of its key vulnerabilities is a shortage of water. Singapore now treats and processes waste water to provide clean drinking water. This source now provides a third of its water needs. It has now become an exporter of expertise in this area to other countries in Asia.
From the beginning, the country set out to be attractive to international businesses. Taxes were set low and restrictions on businesses were very light. In surveys, Singapore regularly comes out near the top for ease of doing business and economic freedom.
To aid Singapore’s attraction to business, the government has been very hard on corruption and crime. It still has the death penalty. Whereas under the British colonial administration, corruption had been endemic, modern Singapore has been ranked the third least corrupt country in the world.
Its trade unions are anything but normal from a western standpoint. There is one single union, the National Trade Union Congress (NTUC), which groups together all independent labour unions. Behaviour which is deemed to disrupt “national, political, corporate unity” could lead to a jail sentence.
Singapore has placed great store by education and it spends heavily on it. But it has been keen to prevent large numbers of students taking liberal arts degrees that would leave them with dubious employment prospects. It strives to raise the status and rewards of teaching as a profession and aims to attract some of the top students into teaching. In 1966, the percentage of the working population with at least secondary education was 15.8%. In 1990 it was 66.3%. In 2020 the percentage of those 25 and over with at least “upper secondary education” was 74.5%. This was well above the figures for Italy and Spain but considerably lower than the equivalent figures for the US, UK, Germany and Japan.
With the highly mixed ethnic make-up of its population, language has been an important factor. The government has insisted that in all schools English should be either the first or the second language. With English the world’s lingua franca, this has stood the country in good stead with regard to international business and helped its attractions to multinational businesses.
Social Security and Healthcare
There are no expensive social security systems in Singapore. Over the years 1990 to 2001, government outlays on social security and welfare amounted to less than 1% of GDP, compared to 13% in the average OECD country.
Financial security in old age is seen as the responsibility of the individual and the family, with the community providing back up support through charity. The state acts only as a last resort. Moreover, there is no formal unemployment insurance scheme.
Basic public healthcare services are 80% subsidised by the state. The philosophy here is that health is a public good. The state also provides an optional insurance scheme (Medishield) which covers low probability but high cost occurrences. The state also provides a safety net scheme for the poorly off (Medifund) so that no one is deprived of essential medical care. But it is subject to stringent means testing.
Lee Kwan Yew encapsulated the thinking behind this system very clearly when he said: “ We did not want a mentality whereby, after paying a health insurance premium, you consume as much in medical procedures and investigations as you or your doctor can think of.”145Lee, Singapore Story, p 127.
The state recovers between 20% and 100% of its expenditure on public healthcare through user fees. A patient who chooses the open ward in a government hospital is subsidised by the government at a rate of 80%. Better off patients who choose more comfortable wards get no government subsidy.
There are also private medical insurance schemes and the private sector competes with the public sector in medical services.
Both the quality of health services in Singapore and their cost effectiveness have been highly rated by international experts.
In 1990-2001, government outlays on healthcare came to only 1.2% of GDP, compared with 6.6% in the typical OECD country. In 2020, health expenditure was 3.2% of GDP. This compares with 10% for the UK, 10.7% for the US, 9.4% for France, 10.1% for Germany, 7.3% for Italy, 7.8% for Spain, 9.7% for Canada and 9.2% for Japan.
Although spending on health, both by government and overall, remains low by international standards, it has been rising as a share of GDP, reflecting population ageing and the tendency for the demand for medical services to grow as people get richer.
Governance
A key pillar of Singapore’s success has been the emphasis placed on good government. In his memoirs, Lee Kwan Yew wrote:
“My experience of developments in Asia has led me to conclude that we need good men to have good government. However good the system of government, bad leaders will bring harm to their people…..The single decisive factor that made for Singapore’s development was the ability of its ministers and the high quality of the civil servants who supported them.”146Ibid, pp. 735-736.
In order to achieve this, in complete contrast to most western countries, including Britain, Singapore has paid its ministers and civil servants extremely well. Lee again:
“If we underpay men of quality as ministers, we cannot expect them to stay long in office earning a fraction of what they could outside…. Underpaid ministers and public officials have ruined many governments in Asia.”147Ibid. p 193.
But civil servants were not only paid well. Singapore subjected them to a system of appraisal based on how executives were assessed in Shell. And civil servants found guilty of receiving bribes are not only prosecuted but they also lose their jobs and their pension rights.
Singapore is a law-based country but it is far from being a democracy in the conventional western sense. It is effectively a one-party state, with the party in question being the People’s Action Party, or PAP. Whatever its demerits from a western viewpoint, one advantage of this system is stability and continuity in economic affairs.
Singapore’s government has had a strong sense of the appropriate structure of society. It has seen the family as the cornerstone of society, including filial piety and deference to hierarchy. Controversially for most westerners, this includes the subordination of women to men.
These values are often described as “Confucian” but this is not really an apt description. The Confucian tradition does venerate authority and deference but it has traditionally despised trade and business. Yet Singapore lauds business and material success. Moreover, its elite is selected purely on its technocratic merits rather than according to its “virtue” as under the Chinese imperial system.
And whereas the imperial Chinese regime stood apart from the individual and saw itself as concerned only with the collection of taxes and the maintenance of order, Singapore’s government is pervasively interventionist and is passionate in pursuit of good management.
Singapore’s ethos has been described by the Singaporean statesman Sinnathamby Rajaratnam as “moneytheism”. Perry calls its system: “capitalism with socialist characteristics”.148Perry, Singapore: Unlikely Power, p 236.
The essential nature of Singapore’s government is perhaps best illustrated by its attitude to gambling. For a long time, led by Lee Kwan Yew, it frowned upon gambling and refused to allow casinos on its territory. But it eventually buckled and there are now two casinos in Singapore. But, true to its essential nature – money-lust combined with paternalism and social conservatism – Singaporeans are strongly discouraged from going. Indeed, if they do, they are subject to heavy fines. The government has accepted gambling and its various deleterious consequences only for foreigners.
The Role of one Man
Singapore’s success was driven by a cadre of highly capable men at the head of the PAP. But the contribution of one man was outstanding – Lee Kwan Yew – who was Prime Minister from 1959 to 1990 and who continued to exercise considerable influence after he stepped down as PM. (Perhaps the next most important figure was Dr Goh Keng Swee, Minister of the interior and Defence.)
Educated in both Singapore and the UK, at the LSE and Cambridge University, Lee was a top student of law and briefly practised as a lawyer. Despite that, he was to prove a remarkably practical and effective ruler. One of his sterling qualities was that he was completely incorruptible.
Strikingly, Singapore has placed great importance on education and its leaders, including Lee, have been both highly intelligent and highly educated. But in complete contrast to imperial China and imperial Britain, whose elites were schooled in the respective classics of their cultures and inculcated with literary skills and values, Singapore’s elites have been technocratic.
Perhaps you could say that Lee was an intermediate case, having studied economics and law. Another of his characteristics is that he was extremely hands-on. When faced with the consequences of the closure of Britain’s military base, he visited Malta, another former British colony which experienced the same thing. And he visited British and Japanese shipyards and experienced at first hand the baleful influence of management’s distance from the workplace and class divisions on British industry.
Lee started on the Left politically and acted as a legal adviser to many trade unions. Yet he embraced policies that are usually associated with the free-market right. Certainly, he was much admired by many of the world’s conservative statesmen from the UK’s Lady Thatcher to America’s President George Bush. But he also commanded respect and admiration from very different quarters, including China’s Deng Xiaoping and, on the left of European politics, Britain’s Denis Healey and Germany’s Helmut Schmidt.
Critics
Although Singapore’s extraordinary economic success has won many admirers around the world, the country has also acquired a few critics of both its economy and its social system.
Singapore has enjoyed a huge increase in population. In 1959, its population was 1.58 million. It is now about 5.5 million. So per capita growth rates are less spectacular than the GDP growth rates without adjustment for numbers of people. Moreover, in common with other Asian “tigers”, Singapore also enjoyed a substantial increase in the participation rate. The result is that GDP per worker grew much less than GDP per capita. Between 1966 and 1990, the average annual real growth rate was 8.7%. Allowing for population growth of 1.9% turns this into 6.8% per capita. But GDP per worker grew by “only” 4.2%.
The economist Alwyn Young149Alwyn Young “The Tyranny of Numbers: Confronting the Statistical Realities of the East Asian Growth Experience”, in The Quarterly Journal of Economics, 1995, p 642. who has analysed the success of four “tiger” economies, Hong Kong, Taiwan, South Korea and Singapore, says that in all of them there was a huge increase in capital, as well as labour. He says that the increase in total factor productivity was comparable to what has been experienced in western developed countries. In 1960, Singapore’s constant price investment to GDP ratio was 10%. By 1980 it had reached 29% and by 1984, 47%. After that it declined significantly, but it rose again in the late 1980s.
Young puts the average annual growth of total factor productivity (counting human capital as a factor of production) in Singapore between 1966 and 1990 at only 0.2%.
But Alwyn Young’s assessment was made in 1995. Even he would surely be impressed by the continued rapid growth of Singapore since then. Admittedly, the rate of growth has subsided but it is remarkable that the country has continued to outpace most other developed countries even after it passed their level of GDP per capita.
So great has been the savings rate, including by government, that the IMF has questioned whether it is too high as it effectively favours consumption by future generations over today’s.150Henri Ghesquiere, Singapore Success, p 2.
It is true that the government has contributed to high national savings both by its design of the social security system and the system of pension provision and by its policy of running budget surpluses. But many observers argue that the high personal savings rate has cultural roots. In trying to explain high Japanese personal saving, the economic historian, David Landes, has argued that this is connected with the atavistic values of the Japanese peasant “who lives for work, and by work adds to his holding; that is his reason for living”.151David Landes, The Wealth and Poverty of Nations, New York, 1999 , p 383. Singaporean citizens are not Japanese peasants tilling the soil but perhaps similar values prevail.
Some critics argue that Singapore’s essential characteristics will make it difficult to sustain rapid growth in the future. They argue that the heavy hand of state involvement will stifle entrepreneurship. Others contend that the emphasis on written examinations, in keeping with mandarin tradition, stifles creativity in education.
Although Singapore’s success has made the average citizen incomparably better off than they were, inequality is high, with a Gini coefficient of 0.54, well above most European countries, and only just behind the US.
Non-economic criticism
For all that, Singapore’s economic achievements are there for all to see. Other, non-economic, aspects of the country are more controversial. Many outside critics of Singapore rile against its maintenance of capital punishment for drug-dealing as well as murder. It is not clear, however, that a majority of its citizens feel this way. Indeed, a survey taken in 2006 found 85% of Singaporeans in favour of mandatory death sentences for murder and drug trafficking.152Jeremy Au Yong, Sunday Times, February 12, 2006, News, p 8. A similar outcome might emerge from a survey of voters in the west.
Despite Singapore’s staggering economic success, many people find it sterile and baulk at its many “nanny state” characteristics. And this feeling is not confined to foreigners. One of Singapore’s key challenges is that every year a large number of its most highly educated and talented people leave the country in search of a better life elsewhere. Meanwhile, Singapore’s birth rate has fallen to 1.1 per woman, even lower than Japan’s rate. Both these demographic factors have caused considerable unease among the country’s leaders.
Part of the leavers’ complaint is political. There are regular elections, and without any suggestion of gerrymandering or vote-rigging. But in the parliamentary elections of 2020, the governing PAP took 61% of the popular vote on a 96% turnout. This gave it 83 of the 93 contested seats. The PAP has been in power continuously since independence.
Moreover, the government has regularly made things difficult for opposition parties and it has used the courts to try to convict opponents, usually accusing them of libel and tax evasion. This approach has led to a considerable degree of self-censorship by journalists, broadcasters and ordinary citizens. As Perry puts it: “ The government lauds and supports competition, except in politics”.153Perry, Unlikely Power, p 252.
One potential weakness of Singapore’s system of government, particularly since Prime Minister Lee was so powerful and so influential in the country’s success, is the question of the transfer of power. Yet since Lee stepped down as PM, there have been two peaceful handovers of power. Admittedly, the current incumbent is Lee’s oldest son. But no one questions his competence.
Answers to key questions
In the introduction to this study, we posed some key questions for each of the countries analysed. Below are our answers to those questions for Singapore.
Was there a plan?
There was no overt plan for Singapore’s development but there was a definite strategy and the government thought long-term about the country’s development. It operated free trade internationally and embraced market forces at home – but with limits. It intervened strongly in the economy, especially in the land and property markets. It envisaged Singapore’s economic structure changing as its skill base and comparative advantage changed. But it was keen to maintain a major presence in manufacturing. Although there were some similarities – particularly with regard to their free trade policies – this was a quite different model from Hong Kong.
How long did it take for improvement to be clear?
There was no period of initial sacrifice that had to be justified in terms of jam tomorrow. Improvement and development were pretty much a continuous process.
Were there losers and how was support for economic development maintained?
There were no obvious large groups of losers from Singapore’s development. But there was certainly opposition to the government from time to time. Such opposition was suppressed. The government never had to deal with an acute political challenge.
Did the transformation of Singapore involve a radical restructuring?
The shape of the economy was radically transformed.
Was there a sequencing of reforms and was this sequence ideal?
Singapore’s development was less about the gradual introduction a series of reforms and more about allowing a set of policies to lead to economic benefits over time, allowing compound interest to do its work.
Did the transformation involve much higher savings by households and/or the whole economy?
High savings played a critical role in Singapore’s development. The rate of capital accumulation was high. Whereas in the early years this had to be partly financed from abroad, in the later years, huge savings by both households and the government more than fully financed this. Indeed, this led to an enormous current account surplus so that Singapore became a significant supplier of finance to the outside world.
Was the transformation the work of one key person?
Perhaps more than in any of our country studies, Singapore’s transformation was down to the achievement of one key man – Lee Kwan Yew. He had the vision, the brains, the determination and the political skills to see the project through. But even he depended upon a cadre of dedicated and like-minded senior ministers and a very able civil service.
Conclusions
Singapore must rank as one of the greatest economic success stories of all time. Central to its success has been good, strong and effective government which has favoured business and striven for economic success. The central pillars which you might think are relevant for other countries, including many in the west, have been: low taxes and business friendly regulation, free trade, stability, low crime and corruption, high rates of investment, and a high priority given to education.
As in so many countries, it is difficult to imagine this happening without the giant contribution of one person – in this case, Lee Kwan Yew. But when thinking about lessons for other countries, we have to be well aware of Singapore’s peculiar political culture and institutions – as well as the debt to that one remarkable man.
How could a western democratic country hope to emulate Singapore’s achievements? And how could it find and sustain in power a leader like Lee Kwan Yew?
Next chapterAfterword – The Way Forward
This study has looked at the experience of eight countries that have undergone economic transformations. We gave a summary of our conclusions at the beginning, together with 10 key lessons. Now the way forward. Policy Exchange’s Policy Programme for Prosperity will sketch out, area by area, a series of reforms to the UK economy that could radically improve the UK’s economic performance and therefore its average per capita GDP, implying the scope for higher living standards.
In future studies, amongst other topics, we will examine the inadequacies of the housing market and the planning system, the costs of crime and the effectiveness of the justice system, the efficiency of the NHS and how it can be improved, road transport and the gains to be had from road pricing, reform of the tax system, and how we can change our education system to make a greater contribution to achieving higher economic growth.
We will look at all these issues from an economic perspective. But the main barriers to achieving substantial economic improvement are not really economic. The main barriers are political – and they are substantial. Yet this does not mean that economists should throw in the towel. This is no time for defeatism. First must come the vision and afterwards the conviction that this vision can be translated into reality. Our Policy Programme for Prosperity is a contribution towards these two things. It is then up to our political leaders to craft a way forward by getting millions of people to buy into that endeavour.
Next chapterA Note on Sources
In this study, we have used data from a wide range of sources. Using Refinitiv Datastream, for most of our data, we have accessed national and international official sources. In a handful of cases, we have used secondary sources.
Sometimes multiple sources have been used in the same chart/table in order to create an extensive database; we have done what we can to ensure comparability across countries in these cases. However, the same measures are not always comparable across countries. (For example, employment rates from different sources may use different definitions of the working-age population.)
For further information about our sources, please contact
ben.sweetman@policyexchange.org.uk.