


Content
+
Quotes
“I used to think that if there was reincarnation, I wanted to come back as the president or the pope or as a .400 baseball hitter. But now I would like to come back as the bond market. You can intimidate everybody.”
– James Carville, Chief Strategist to Bill Clinton (1994)
‘Stability is necessary for our future economic success. The British economy of the future must be built not on the shifting sands of boom and bust, but on the bedrock of prudent and wise economic management for the long term.’
– Gordon Brown (2000)
‘Being lectured by the president on fiscal responsibility is a little bit like Tony Soprano talking to me about law and order in this country’
– John Kerry (2004)
“What we need to do to establish the centre-right alternative, which consists of fiscal responsibility, financial responsibility and a balanced economy.”
– David Cameron (2008)
‘After a decade of profligacy, the American people are tired of politicians who talk the talk but don’t walk the walk when it comes to fiscal responsibility. It’s easy to get up in front of the cameras and rant against exploding deficits. What’s hard is actually getting deficits under control. But that’s what we must do.’
– Barack Obama (2010)
‘The most politically painless way to hand out goodies, without taking responsibility for their costs, is to pass a law saying that somebody else must provide those goodies at their expense, while the politicians take credit for generosity and compassion.’
– Thomas Sowell (2011)
Sound money and fiscal responsibility are the only secure foundations of a fair and strong economy.
– George Osborne, 2017
Next chapterIntroduction
It is easy to become distracted by the turmoil that has overtaken Westminster. What must not be forgotten is that underlying this is a severe economic crisis, that at this moment is directly impacting millions of people across the country. Charting a way through these difficult economic waters is the principal task awaiting our new Prime Minister.
Our country is deeply in debt, with a deficit that is viewed by the markets as being on an unsustainable path. Elements of this crisis are global in nature. Rising inflation and interest rates are happening across the world, as is the energy crisis precipitated by Putin’s war in Ukraine. Much, however, is home-grown. High spending during the pandemic had already put the national budget under strain. The mini-budget, however, and its fall out has undoubtedly made the situation worse. Significantly increasing borrowing, both for an indiscriminately generous energy package and unfunded tax cuts, with no credible plan to get debt back under control, has spooked the markets. Gilt yields rose sharply (though have since fallen back), the cost of the interest we pay on our debt has risen and market scrutiny of our finances has risen. The Government must now take greater steps to put debt back on to a sustainable path than would otherwise have been the case.
In this paper, Policy Exchange offers a range of options for the new Prime Minister. We recommend that they should impose a windfall tax on energy producers and, from April, significantly scale back the energy support package – as we first argued in September. Beyond that, there are choices. If the Government is prepared to tackle some of the biggest lines in the budget, such as ending the pensions triple-lock, rescoping major over-running public infrastructure projects or reducing the benefits received by wealthier individuals, then the pressure to make savings elsewhere will be less. If not, then more savings will need to be found from front-line public services – or else taxes will need to rise.
In order to consider these options properly, we welcome the fact that the new Prime Minister has delayed the fiscal event from 31 October to 17 November. This will enable a fuller consideration of the decisions that will shape the country over the following years.
Alongside this, investment in productive capacity such as transport, energy and skills, and regulatory changes that enable greater business investment and innovation, should be prioritised. It is essential that Government presses ahead with supply-side reforms, particularly in areas which are impacting the most on growth and household budgets such as housing and childcare. The mini-budget was right in one critical respect: the UK’s sluggish growth is the root cause of our underlying economic challenges. We do not underestimate the political challenges to implementing these reforms, but they are essential if we are to restore our long-term prosperity.
There are no easy answers. Our new Prime Minister faces difficult choices. They would be faced by any Prime Minister, of any party, taking office at this time.
There is no royal road to fiscal responsibility; no path to be taken that does not involve difficult, unpopular, decisions. Our purpose at Policy Exchange, in publishing this paper, is to outline some of the options available for restoring the economy back on to a sustainable path.
Next chapter1. Executive Summary
No Government can ignore the bond markets for ever.
The events of recent weeks, which have seen the yield of UK gilts rise to their highest in over a decade, a fall in the value of the pound, sharply rising mortgage rates and an unprecedented intervention by the Bank of England, in which it committed to buy up to £65bn of government bonds to stabilise the markets and protect pension funds, have brought this home in a way in which a decade of warnings have not. Unprecedented borrowing, first to mitigate the impact of the COVID-19 pandemic, and then as a response to the global energy crisis, have been compounded by a series of unfunded tax cuts. The turmoil created by this has already led to a succession of u-turns and the exit of first the Chancellor of the Exchequer and then the Prime Minister.
It is no surprise that governments are tempted by borrowing. Both increases to public services and tax cuts are in isolation – with a few notable exceptions – popular amongst the voters who will benefit from them. As Rt Hon Lord Peter Mandelson, writing for Policy Exchange in the foreword for McDonnellomics (Policy Exchange, 2019), observed, “The Conservatives, while condemning Labour’s tax and spend policies, are nonetheless turning on spending taps of their own.”1https://policyexchange.org.uk/wp-content/uploads/2019/10/McDonnellomics-How-Labour%E2%80%99s-economic-agenda-would-transform-the-UK.pdf The stagnation in UK productivity growth and real wages since the Great Recession has reduced the ability of the state to fund demands on the public purse through growth, leading to a steady rise in the proportion of GDP taken in tax and a greater incentive to borrow.
Nevertheless, responsible governments of all stripes have understood the imperative to work within a credible economic framework for managing the deficit, that took account of the wider economic and financial concept. From Tony Blair and Gordon Brown’s pledge to match Conservative spending plans for the first two years after 19972http://www.labour-party.org.uk/manifestos/1997/1997-labour-manifesto.shtml, to David Cameron and George Osborne’s ‘Long-Term Economic Plan’3https://www.gov.uk/government/publications/the-governments-long-term-economic-plan/the-governments-long-term-economic-plan, a focus on responsible fiscal policy has rightly been at the heart of national decision-making for decades.
This does not mean there is no room for disagreement or debate: there were significant differences between Alistair Darling’s proposed approach to reducing the deficit and George Osborne’s. It is not always wrong to borrow: a national budget is more complex than a household one and, in a time of reduced demand and constrained liquidity such as the COVID pandemic, fiscal support is likely to be appropriate. Previous governments have recognised, however, the importance of doing so within a sensible credible framework, backed up by institutional credibility and stability, which ensured that any borrowing needed in the short term was not set on an unsustainable path. This is one of the principal reasons that governments have created mechanisms to help keep borrowing under control, including the introduction of ‘fiscal rules’, placing constraints upon government borrowing, and the creation of the Office for Budget Responsibility.
The fundamental diagnosis of the Truss government, that the trend rate of growth needs to improve, was correct. If growth rates had continued at their pre-2008 trend, the UK’s labour productivity would be about 18% higher today than it actually is in constant dollars, with commensurate gains to GDP and household income4https://committees.parliament.uk/publications/23031/documents/168790/default/. Spending on the public sector has increased, but too often in ways which do not improve public sector productivity or leave the general public feeling that they benefit from improved services. With the tax burden at its highest as a share of GDP since the 1950s, there is clearly room in the medium-term to reduce taxes, if this is done in a responsible way: as growth improves, spending on automatic stabilisers will decrease, and the structural deficit can be reduced if there are changes to the scope and size of the state or the way that public services are delivered. There there is a strong case for supply side measures to boost growth and productivity, particularly in highly supply-constrained sectors such as housing and childcare, as well as more broadly, where it is estimated the burden of regulation has increased costs on business by over £12bn since 2017.
A clear-sighted focus on growth is the only way to improve the UK’s medium-term prosperity. In the new Prime Minister’s Mais lecture, earlier this year he singled out capital investment, skills and innovation as fundamental to accelerating growth5“So in accelerating growth, I have three priorities. Priorities that I believe will foster a new culture of enterprise and deliver a higher growth rate. The first is to encourage greater levels of capital investment by our businesses. Second, we need to improve the technical skills of the tens of millions of people already in work. And third, we want to make this the most innovative economy in the world by driving up business investment in research and development.” The then Chancellor, Rt Hon Rishi Sunak MP, February 2022. https://www.gov.uk/government/speeches/chancellor-rishi-sunaks-mais-lecture-2022. We endorse this position: as the Government sets out upon the essential task of bringing debt under control, it should do so through a lens that carefully assesses the implications of spending, cuts and regulatory reforms upon our future growth rates. Investment in productive capacity such as transport, energy and skills, or regulatory changes that enable greater business investment and innovation, should be prioritised, where possible, over spending that is not focused on building our economic capacity or regulations which stifle growth.
The mistake of the mini-budget, however, was to assume that higher growth could be obtained by throwing fiscal responsibility to the wind – and to fundamentally misread the broader economic conditions of high inflation, low unemployment and a global energy crisis. These are global challenges: inflation and interest rates are rising internationally and energy is a globally traded commodity. The global reversion towards a more historically normal interest rate environment after a period of low interest rates and quantitative easing would have been challenging in the best of circumstances.
There can be no doubt, however, that the mini-Budget has made the task harder, even following the reversal of most of its major measures. In borrowing costs alone, the rise in the yield of UK bonds means that the Government must potentially find an additional £10 billion per year to service the debt6https://ifs.org.uk/publications/ifs-green-budget-2022. The sharp rise in mortgage rates will damage consumer confidence and depress household spending. In addition, the political capital that has been spent will increase the difficulty of driving through serious supply-side reforms.
It is useless to argue, as some do, that the UK continues to have the second lowest debt to GDP ratio in the G7. The cost of borrowing does not depend on any one single metric, but upon overall expectations of inflation, future interest rate rises and creditworthiness. The wider circumstances around the recent fiscal event, including the failure to obtain an OBR forecast, or even a Treasury forecast; the dismissal of the Permanent Secretary of Her Majesty’s Treasury; the initial failure to consider spending controls or savings; the decision to adopt an energy package significantly more generous than that of comparator nations; and the subsequent briefing of further tax cuts to come have combined to do lasting damage. It is not the case that any of these in isolation are egregious – for example, there is a practical case for an expansive energy package, and a government must be able to dismiss senior officials in whom it has lost confidence – rather, the combination of all in concert proved fatal.
There is now an urgent imperative to get the public finances under control. The high political salience of the decision – now reversed – to abolish the 45p top rate of income tax in public debate temporarily obscured the fact that this represented only a small portion of the total additional fiscal widening added by the mini-budget. Ongoing market turmoil has forced significant further u-turns, with almost all tax cuts announced in the mini-budget now reversed, with the exception of the National Insurance Contributions and Stamp Duty relief. Corporation Tax will now rise to 25% as scheduled, income tax will remain at 20p indefinitely and various smaller measures, such as on the treatment of off-payroll working, have also been cancelled. These reversals, calculated as raising an additional £32bn7https://www.gov.uk/government/news/chancellor-brings-forward-further-medium-term-fiscal-plan-measures, are welcome, as is the decision to review after six months the Government’s overly expansive energy plan, one of the costliest in Europe.
These changes will not, however, be sufficient by themselves to get the public finances back on track. The new Prime Minister, faces a tremendously challenging series of choices. Even after the u-turns already made, there remains a predicted £25-30bn gap to have debt falling as a share of GDP within five years8Ibid. Furthermore, even if the Government sticks within the 2020 Spending Review settlement, the impact of inflation will mean a real terms reduction of £23bn in 2024-259Ibid. This must not just be top-sliced across all budgets: there are some forms of spending, such as research and development, infrastructure and other forms of capital investment, that can be beneficial to the growth outlook of an economy. Whether it is a Conservative Government seeking to lower taxes, a Labour Government, at some point in the future, seeking to invest more in front line services or a Government of any party seeking to lower the annual interest payments, finding efficiencies within public spending is essential.
At Policy Exchange our position is clear: both unfunded tax cuts, and unfunded spending, pose a potential threat to fiscal responsibility, and any borrowing must be accompanied by a detailed, credible and deliverable plan to show how debt will be kept on a sustainable path.
The Government should adopt a three-part approach to restoring the public finances. Firstly, it should adopt a set of measures on immediate taxing and spending, including proceeding with a significant retrenchment of its energy plan and imposing a temporary windfall tax on producers and generators; secondly, it should make a series of measured efficiency savings in public spending, while protecting front-line services as far as possible; and thirdly it must rapidly advance proposals to stimulate growth through supply-side reforms. Throughout, this should be done in a way which protects and enables the future drivers of growth. All of these should be embedded within a new, credible, fiscal framework that will ensure that all economic actors, including the markets, know how the public finances can be made sustainable over the cycle.
On taxation, welfare and the energy package, the Government should implement an immediate additional windfall tax on oil and gas producers, raising an additional £9-16bn, as well as proceeding with a large-scale public information campaign to assist in energy saving, saving £450m. To control the cost of the energy price guarantee, from April 2023 it should move to a tiered energy subsidy scheme, which would both be more progressive and would allow market mechanisms to increase the incentive for higher users to save energy, saving a further £12.9bn. The Government should continue to uprate both benefits and pensions by inflation, but should proactively tackle the cost of the welfare budget by reducing Universal Credit fraud to 2018-19 levels, saving up to £4bn – £5bn annually, and instigate a review of which benefits are taxable, including winter fuel allowance, disability living allowance and child benefit, to ensure wealthier individuals do not benefit disproportionately whilst removing cliff-edges in the tax system. Finally, on pensions, they should consider ending the triple-lock and instead link pensions to average earnings, saving £11bn in 2024-25.
The Government has choices as to the balance between the actions it takes on taxation, welfare and energy; and on public sector efficiencies. If it is unwilling to retrench significantly on the energy package, to levy a windfall tax or to address major outlays such as the triple-lock, it will need to make additional savings from public services.
On public sector efficiencies, even if no additional reductions are made to the 2020 Spending Review envelopes, the increase in inflation will necessitate real term cuts in departmental spending. The Government should not simply salami-slice by attributing these savings across the board, but instead actively prioritise to drive efficiencies, reduce spending on less effective programmes and protect spending on front-line service. We propose a non-exhaustive, indicative, menu of options that would collectively generate £20bn – £25bn of savings across the public sector. These potential measures include an immediate, rapid, re-assessment of all major transport projects, to assess whether each should be continued, rescoped or cancelled; reforming prescription charges, including by charging wealthier individuals who currently receive free prescription, raising £2-3bn annually; increasing NHS land-disposals to raise £3-6bn; a fourth wave of clinician-led reviews of NHS activity saving £1-2bn annually; cancelling one of the six new prisons, saving £500m; reprioritising at least £2.8bn within the schools budget from education support staff, back-office staff and educational consultancy to other priorities; saving £200m – £300m from the underperforming Multiply and traineeship programmes; saving £150m – £250m from non-growth orientated Higher Education funding and introducing a minimum entry requirement of EE for undergraduate degrees; saving £3.5bn from headcount reductions in the civil service and arm’s length bodies, including up to £1bn alone from merging DHSC and NHS England; reduce civil service consultancy spend by £1.3bn; as well as a number of smaller measures. We also recommend that we do not significantly increase the defence budget within this spending review period, including not moving to spend 3% of GDP until it has we are spending the money we currently allocate more effectively.
The Government need not make all of the savings set out in this section; however, the ongoing budget erosion being applied by inflation will mean that a significant number of efficiencies will need to be made, even if the Spending Review settlement is not reopened.
On the supply side, four of the areas with the greatest potential reform are planning, childcare, retained EU law and reducing business red tape. The proposed Retained EU Law (Revocation and Reform) Bill offers an important opportunity to support the Government’s supply-side objectives outlined in the Growth Plan, but with 2006 pieces of retained EU law that remain unchanged, the Government must focus on the areas that will make the most difference, including financial services, DEFRA and planning. The House Builders Federation estimates that “at least 100,000 new homes across 74 Local Authorities are unable to proceed” due to requirements of retained EU law; the Government should also increase the building of Council housing, building at least 100,000 a year. Meanwhile, reforms to Solvency II could unlock up to an additional £95bn for infrastructure and real estate. By implementing a regulatory budget process overseen by the BEIS Secretary, Government should allocate each department a ‘regulatory budget reduction allocation’ and adopt a target of £15 billion in net regulatory savings for business over the next five-year cycle. Finally, childcare reforms to increase ratios and reduce the bureaucratic burden on childminders, as set out in the Policy Exchange paper Affordable Childcare (2022), would both assist households with the cost of living crisis and support parents back into the workforce.
Policy Exchange will be publishing further papers, exploring a number of the supply side issues in more depth, in the coming weeks. In an increasingly uncertain international environment, where economic shocks may be both more frequent and more severe, the supply-side reforms are essential. Increased growth – likely to include an economy that is rebalanced both sectorally and regionally, greater infrastructure investment and significant reforms in planning – is imperative if we are not to enter a period of perpetual austerity.
Overall, the scale of the structural deficit is too great to be met by any single measure alone – a combination of solutions are needed, alongside supply-side reform. A combination of measures, including implementing short-term revenue raising mechanisms such as an increased windfall tax, public spending efficiencies and significant supply-side reform must be implemented rapidly to place the public finances back upon a sustainable footing.
Next chapter2. Economic Background
The UK faces an acute short-term crisis and chronic long-term challenges. The short-term crisis is three-fold.
- An exogenous shock to the terms of trade driven by the war in Ukraine and rising energy and commodity prices.
- A tight labour market thanks to dislocations created during the pandemic, including a rise in long-term illness.
- A high degree of market volatility, including increased market concern over UK Government stability, which has resulted in rising gilt yields and higher interest rates than might otherwise have been the case. This has increased the cost of Government borrowing and will constrain Government action in the future.
The new Prime Minister will need to address these challenges head on. In the case of the terms of trade shock, the Government has intervened directly and comprehensively to reduce energy costs for consumers and businesses. Government has absorbed the cost of the exogenous shock, contributing to lower inflation in the short-term and protecting spending power now to prevent insolvency both in households and enterprises.
On the second point, however, Government has had to respond to a fast-changing situation in the markets, partly of their own making. While the global reversion towards a more historically normal interest rate environment after a period of low interest rates and quantitative easing would have been challenging in the best of circumstances, there is no doubt that the mini-budget has made the situation worse. While it is still to be debated whether the markets over-reacted or not to the original Growth Plan announcement, the market would have in all likelihood begun to price in higher interest rates as a result of the fiscal loosening at the heart of the Government’s new strategy. What was almost certainly not planned was a more than 100 basis point increase in the 30 year gilt yield.10Bloomberg UK. United Kingdom Rates and Bonds. 11 October 2022. Link. Furthermore, projections that the Bank of England’s policy rate would be 125 basis points higher by December this year and 175 basis points higher by Q2 2023 were also likely unexpected.11Fitch Ratings. Deeper UK Recession Now Likely as Interest Rates Rise Faster. 10 October 2022. Link.
The implications for the UK economy could be severe. Fast rising interest rates will dampen growth significantly. Moreover, interest rate and yield rises will make borrowing more costly. The most recent projection suggests that spending on debt interest will be £103 billion, £52 billion more than projected by the OBR in March of this year; it will be £18 billion in the year 2026-2027.12IFS. Outlook for the Public Finances. 11 October 2022. Link.
Some of the increased borrowing costs is a direct result of the quantum of fiscal loosening announced in the Growth Plan – borrowing was going to be higher as a result. However, the cost of servicing the debt is higher than it otherwise would be because of the market reaction. In this context, Government must take steps to regain market confidence and aim for a more gradual and less volatile rise in interest rates and yields.
This is not just for the sake of the public finances, but for the wider financial system as well. The abrupt rise in interest rates sparked by the Growth Plan has threatened defined benefit pension funds who employ liability driven investment strategies with insolvency. The hedges behind the LDI strategy have, thanks to the fall in the value of bonds, led to a potential ‘fire-sale’ dynamic, requiring Bank of England intervention. Government will have to take steps to stabilise the market, both for its own sake and for the wider financial sector.
To do so, Government must look at ways to reduce expenditure and increase revenue. Government has already announced reversals to some of the tax policies proposed in the Growth Plan, and they have floated the idea of a wider windfall tax. Alongside these measures, though, there will have to be some attempt at reducing expenditure. Relying simply on growth projections to forecast higher revenue have wide uncertainty and the markets may not find them credible. In that context, Government must be able to commit to fiscal decisions that reduce borrowing forecasts and give markets certainty about the future debt path of the state.
However, in taking steps to shore up the Government’s fiscal house, ministers must be cognisant of the long-term challenges facing the UK economy – low growth, low productivity and low investment.
The Growth Plan was right in one key respect – a path where greater state obligations are paid simply through a higher tax take are ultimately unsustainable. Stagnant economic growth has meant that less can be spent on public services, and a greater tax burden has to be levied to pay for those public services that are currently offered.
Low growth has been generated in part by low productivity. While many countries have struggled to restore the levels of growth seen before the Great Recession, in some key areas the UK has lagged some of its peers. In particular, in terms of output per hour worked, while most G7 countries have seen lower growth post-2008 than in the two decades before, the UK and the US have seen the greatest slowdowns, with productivity growth per hour in the UK over this period lagging Japan, Germany, France and Italy13ONS. International comparisons of UK productivity, final estimates, 2020. 20 January 2022. Link.. If the UK’s GDP per capita growth between 2008 and 2021 was repeated in this decade, the UK would become the poorest country in the Anglosphere by 2028.
Since 2008, the UK has had the second lowest productivity growth in the G7, ahead of only Italy. If productivity growth between 2008 and 2021 had been the same as between 1997 and 2008, UK workers would be producing $10.33 (£6.62) more per hour than they are currently.14OECD. GDP per hour worked. PPP 2015 USD. Link.
Actual vs Trend GDP Per Hour Worked, 2015 PPP, USD
Thanks in part to low productivity and low wage growth, UK households are now more than $7,000 poorer than their German counterparts.15OECD. Household Disposable Income. Link. There have been worries that the UK is becoming like East Germany, but in fact the regions of East Germany are now richer than most regions of the UK.16Imactivate using Eurostat data. Regional GDP explorer, indexed. Link.
Household Disposable Income, USD PPP
And amongst all this, the UK continues to face chronic investment challenges and regional inequalities. It is true that many of the challenges faced by the UK, including on planning and infrastructure, are not unique to us, with many developed countries grappling with how best to address them. Nevertheless, business investment in the UK continues to be the lowest as a proportion of GDP in the G7. UK institutional investors invest less in productive assets, like infrastructure and private equity than their international peers.17Thinking Ahead Institute. Global Pension Assets Study 2022. Link. In terms of investment on research and development, the UK is fifth in the G7 and at the bottom end of the OECD (though recent statistical reclassifications may impact this).18OECD. Gross domestic spending on R&D. Link. In terms of skills investment, the UK invests half the OECD average.19Sunak, Rishi. Mais Lecture. 24 February 2022. Link. Our cities outside of London underperform international peers substantially.20Swinney, Paul. So you want to level up? Centre for Cities. 17 June 2021. Link.
Investment as a Percentage of GDP
The Government thus has a significant challenge ahead of it: consolidating the public finances in ways that are not counterproductive to its growth strategy, and which will defeat the thrust of the plan in the first place. In that vein, this plan puts forward savings in areas where the economic impact is likely to be least negative, a set of supply-side reforms that could potentially have the strongest impact on growth, and a set of recommendations on reforming the state that will maximise efficiency both in terms of spending and in terms of effectiveness.
The new Prime Minister must signal to the markets that it has a plan to tackle the immediate credibility gap, while also playing the foundations for a better growth trajectory going forward. This Policy Exchange report aims to help Government fulfil this weighty endeavour.
Next chapter3. Taxation, the Energy Package and Welfare
The former Government’s Growth Plan announced over £200bn of unfunded spending decisions and tax cuts, including the largest (by share of GDP) energy support package in Europe. The size of this package, potentially when combined with a number of the aspects as to how the announcement was handled, has led to significant turmoil in the financial markets, a sharp rise in gilts and the need for the Bank of England to intervene to stabilise markets.
Market turmoil has since forced the Government to reverse the majority of the decisions announced in the mini-budget, with the exception of the National Insurance Contributions and Stamp Duty release. A number of smaller, pro-growth measures such as the £1 million Annual Investment Allowance, the Seed Enterprise Investment Scheme and the Company Share Options Plan have also been retained, at least for now. Corporation Tax will now rise to 25% as scheduled, income tax will remain at 20p indefinitely and other measures such as on the treatment of off-payroll working and the freeze on alcohol duty have been cancelled. These reversals, calculated as raising an additional £32bn21https://www.gov.uk/government/news/chancellor-brings-forward-further-medium-term-fiscal-plan-measures, are welcome, as is the decision to review after six months the Government’s overly expansive energy plan, one of the costliest in Europe.
It is our view that the six-month review should deliver a significant retrenchment with regards to the size and generosity of the energy package, by shifting to a more progressive, more market-responsive tiered energy relief scheme and the extension of a windfall tax on oil and gas producers. Though this will not directly impact the structural deficit, it will reduce the increase in the stock of debt significantly (and thereby reduce interest payments). This will provide greater headspace to reassure the markets, and allow a combination of growth and efficiency savings to have debt falling as a percentage of GDP.
In the current economic climate and cost of living crisis, we believe that benefits should be uprated in line with inflation. It is not right to make the poorest in society bear the brunt of getting our public finances back in order. Nevertheless, pensions and benefits account for around a quarter of public spending and a serious consideration of where money can be saved is essential in order to moderate Government outlay and ensure that front line services are not asked to make disproportionate savings.
We have therefore set out four principal areas in which savings can be made, while continuing to uprate by inflation. Tackling fraud in Universal credit, where a reduction in fraud levels to 2018-19 levels would save £4.8bn annually by 2024-25; a review of the taxability of benefits received by wealthier individuals including winter fuel allowance and disability living allowance; reducing the number of people on incapacity benefit and moving from a triple lock to a double lock on pensions, which would save £bn annually by 2024/25.
3.1 Taxation
The Government has now reversed its decision on the majority of tax-cutting measures in the mini-budget, including on the top rate of tax, on corporation tax and on income tax. We welcome these decisions. While there should be a medium-term objective to reduce the burden of taxation as a proportion of GDP, this is not a justification for placing government borrowing upon an unsustainable path.
3.2 Energy
Reforms to the recently announced energy support programs provide some of the largest possibilities for stabilizing and improving the nation’s fiscal situation.
In response to global increase in energy prices driven by the Russian invasion of Ukraine, there was an overwhelming need for Government measures to relieve the full cost of gas and electricity prices, which otherwise would have pushed millions of households and businesses into fuel poverty this winter. The intervention consists of several components, namely:
- Energy Price Guarantee (EPG): caps the unit price that (standard variable tariff) consumers pay for energy at 34p/kWh for electricity and 10.3p/kWh for natural gas, effective October 1st initially to last for two years, but now to be reviewed from April 2023. In addition, green levies will be transferred from bills onto the Treasury. This will see the average household pay an average of £2,500 per year, a savings of £1,000 versus the October price cap. Total cost: estimated £70bn to £140bn over two years22Counting the Costs: Forecasting the financial impacts of the Energy Price Guarantee on the UK government, 5 October 2022, Cornwall Insight: https://portal.cornwall-insight.com/s/blog-article/aCa8d00000003ijCAA/counting-the-costs.
- Energy Bill Support Scheme (EBSS): provides an additional £400 support payment for all households. Total cost: £11.6bn
- Energy Bill Relief Scheme (EBRS): concerning business and other non-domestic users, the scheme effectively freezes energy prices for six months, at £211/MWh for electricity and £75/MWh gas. A review conducted in three months’ time will determine the most vulnerable industries and how to support them after the scheme expires. Total cost: estimated £29bn to £44bn over six months.
- Energy Supplier Obligations: supporting households to insulate their homes with efficiency measures, including insulation coming into effect as of April. Total cost: £1bn over three years.
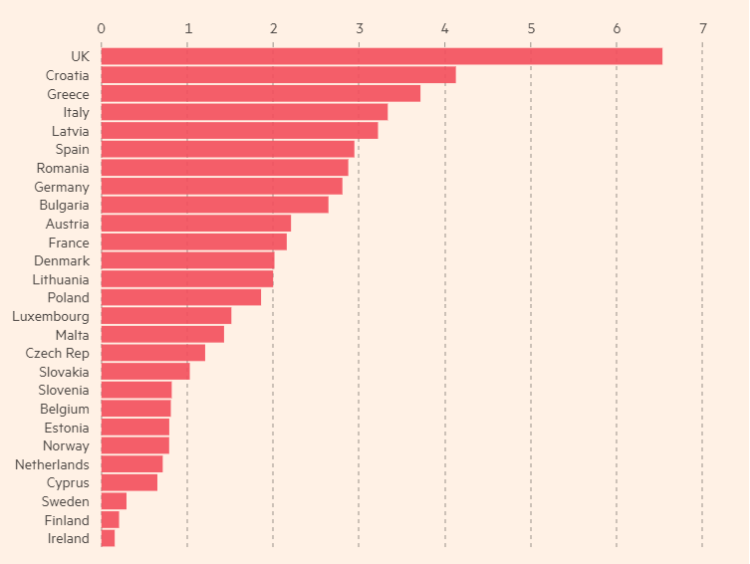
There are significant concerns with both the structure of the EPG and its messaging to the public. The level of support provided is significantly higher than most other countries in Europe, with a corresponding cost. For this reason, we welcome the commitment by the Government to renew it after six months, in order “to design a new approach that will cost the taxpayer significantly less than planned whilst ensuring enough support for those in need…and that the new approach will better incentivise energy efficiency.”23https://www.gov.uk/government/news/chancellor-brings-forward-further-medium-term-fiscal-plan-measures
State support for energy consumers as % of GDP
The EPG is also insensitive to market signals and reduces the incentive to conserve energy, even for the highest users. The Treasury incurs costs for every single unit of energy consumed and the natural price signal to encourage conservation is greatly distorted. These issues have been exacerbated by messaging on “the average household will pay no more than £2,500 this year”, creating the false impression amongst numerous families that their annual bill will be capped at that figure regardless of their total consumption. Regrettably, this misunderstanding has been repeated over media by senior political leaders, leading to further confusion.
The potential consequences of this misconception extend far beyond excess household energy bills. As explained by the National Grid, several factors outside of the Government’s control, namely abnormally cold temperatures or energy supply disruptions in Continental Europe, could force UK into controlled demand reductions or even uncontrolled blackouts this winter24UK winter blackouts warning if energy imports dry up, 6 October 2022, Emily Gosden, The Times: https://www.thetimes.co.uk/article/national-grid-uk-winter-blackouts-warning-7x9h2sp2t. To avoid this devasting and likely fatal scenario, every effort that is within the Government’s control must be undertaken to conserve domestic energy supplies, particularly during periods of peak demand. Fortunately, these measures could complement improvements to the fiscal situation.
Last month, Policy Exchange proposed a Tiered Energy Relief Scheme (TERS), providing heavier subsidies for low levels of household energy consumption that gradually taper off at higher levels of energy demand which are exposed to true market prices25A Plan for Household Energy Bills, 1 September 2022, Policy Exchange: https://policyexchange.org.uk/publication/a-plan-for-household-energy-bills/. Such design is advantageous in limiting the Treasury’s liabilities, while simultaneously delivering a clear signal to reduce personal consumption levels at a time of international energy shortages.
At the review point in April 2023, Government should transition to a TERS or a similar, consumption-limited design. Costs for EPG will depend on wholesale gas prices and total demand, hence the wide range of Cornwall Insight’s forecast.
While a range of consumptions ratios are possible, we estimate that enacting a simplified tiered subsidy effective April 1st would relieve Treasury expenditures of £5.11bn on electricity and £7.87 bn on natural gas subsidies, a total saving of £12.98 bn for the subsequent 2023-2024 fiscal year. 26Under a simplified, single-tier structure whereby the first half of average household consumption would be subsided down to 75% of the EPG price. Further savings would be achieved under demand reductions.
For practical and political considerations, £3bn of savings should be aggressively re-invested into the Energy Supplier Obligations for household efficiency upgrades, effectively immediately. Proactive outreach must focus on the worst insulated homes liable to be most adversely affected by the new subsidy limits, to improve their heat retention by next winter. Further support should be delivered through another £3 billion of direct cash payments to the most vulnerable, rather than subsidizing (and thereby encouraging) energy consumption.
This program change should be couched in response to the high and growing threats of uncontrolled power outages this winter by launching a public information campaign encouraging energy conservation. This would focus on simple and practical measures, such as reducing flow-temperatures on boilers to 55 degrees and shifting laundry machine usage to late evening hours.
This information should be delivered through a well-funded national advertising campaign through social and traditional media, with messaging that emphasizes the temporary nature of the crisis and embraces the patriotic “war footing” rhetoric favoured by politicians. Empowering citizens to make sensible decisions about their personal energy consumption and save money is no more “nanny-state” than road signs advising of upcoming intersections. From the perspective of fiscal responsibility, the argument is undeniable. The contemplated £15 million invested in educating consumers on conservation could yield an estimate of savings of £152m from electricity and $310m from natural gas through reduced subsidies for the EPG for the remainder of this year27Academic consensus on efficacy of energy-saving information campaigns is highly inconclusive; studies demonstrate results ranging from negative effects to savings of 8% (see “Information campaigns for residential energy conservation”, Andor, Mark Andreas et al, Ruhr Economic Papers, NO. 871, December 2020). We conservatively presume a demand reduction of 2% for natural gas and 1% for electricity..
3.2.1 Energy: Windfall Tax
The former Government’s aversion to windfall taxes on power generators to fund the EPG is based on sound economic principles and business theory. Such measures are highly arbitrarily and distortive, an effective expropriation from those who invested in delivering the energy resources Britain so desperately needs. Most problematic is the corrosive effect on investor confidence, which will be critical in this sector to achieve both the near-term expansion of hydrocarbon production and the medium-term transition to net-zero power generation.
However, developments over recent weeks have changed this calculation. The nation’s weakened fiscal outlook and higher borrowing is now the greater challenge to financing our decarbonization agenda than the moral hazard of windfall taxes. Further, recognizing the severe socioeconomic threats posed by record energy prices, leading energy companies like Shell are accepting the need for enhanced taxation on their earnings to “protect the poorest.”28https://www.lbc.co.uk/news/uk/shell-boss-calls-on-government-to-introduce-windfall-tax-on-energy-companies-to/ Ultimately, democratic pressure and political realities must prevail over theory in supporting families over corporate profits, with a tremendous three quarters of voters being in favour. The EU having recently imposed a 33% rate on taxable surplus profits on fossil fuel companies, and raising an estimated €117bn from low-carbon producers, weakens the competitive arguments for abstaining.
The revenue potential is significant. The 25% “energy profits levy” introduced by Rishi Sunak in May was initially expected to raise £5bn from North Sea oil & gas operations this year, but has since been revised to an estimated £7.7bn (and up to £28bn by 2025/2026).29“Tax on energy profits to rake in £28bn as prices surge”, 23 September 2022, The Telegraph: https://www.telegraph.co.uk/business/2022/09/23/tax-energy-profits-rake-28bn-prices-surge/ This is on top of the regular corporate tax of 40% they already pay, double that of most businesses. But even with an effective rate or 65%, Britain is still below the global average of 70% and well beneath Norway’s 78% rate of taxation.
Further, Treasury estimates for the next two years suggest that gas producers and electricity generators could earn excess profits of £102bn and £68bn, respectively, a total of £170bn30“UK Sees Up to £170 Billion Excess Profits for Energy Firms,” 30 August 2022, Bloomberg: https://www.bloomberg.com/news/articles/2022-08-30/uk-predicts-up-to-170-billion-excess-profits-for-energy-firms?leadSource=uverify%20wall. Preliminary estimates for industry analysts suggest a windfall tax on renewables alone could generate up to £14bn for the year, providing over £400 of support per household.31“Renewable energy giants face £14bn windfall tax”, 09 October 2022, The Times: https://www.thetimes.co.uk/article/renewable-energy-giants-face-14bn-windfall-tax-vw6m0xg9t Under these circumstances, the government must consider a change of policy direction, offering companies a carrot and stick approach.
As part of the energy intervention, the Department of Business, Energy & Industrial Strategy (BEIS) also launched the Energy Supply Taskforce to negotiate with domestic and international suppliers in bringing down wholesale prices, both natural gas and electricity. The prospect of a windfall tax must be leveraged to achieve the best deals for Britain.
In realising these revenue opportunities, some approaches are better than others. One model, the recently contemplated “Cost-Plus-Revenue Limit” on renewable generators and nuclear has elicited vocal concern from industry. Pending clarity on the operational details, analysts are concerned the scheme would have the same negative impact on investor confidence as a straightforward windfall tax, but with significantly greater complexity, a higher risk of permeance, and no deductions for making domestic investments.
Whatever their earlier reservations, evolving market conditions more than justify a change in the government’s position. A clean, time-limited windfall tax on applied across the board on extraordinary profits makes more sense, both for tax revenue generation and investment certainty.
As a negotiating strategy, electricity generators and gas suppliers that subscribe to a domestic pool price and new Contracts for Differences (CfDs) that reduces the near-term cost of each commodity could be offered a partial exemption from any windfall tax. Producers and generators that abstain from pooled pricing and choose to take full advantage of wholesale markets should be taxed accordingly. Pending these discussions, benchmarks of an additional £5bn to £10bn from gas producers and a new windfall tax worth £4bn to £6bn from electricity generators would be reasonable targets, for a total revenue generated of £9bn – £16bn.
3.3. Benefits
In the current economic climate and cost of living crisis, we believe that benefits should be uprated in line with inflation. It is not right to make the poorest in society bear the brunt of getting our public finances not in order. Nevertheless, pensions and benefits account for around a quarter of public spending32https://obr.uk/forecasts-in-depth/brief-guides-and-explainers/public-finances/ and a serious consideration of where money can be saved is essential in order to moderate Government outlay and ensure that front line services are not asked to make disproportionate savings.
3.3.1. Reducing Benefits Fraud
Fraud levels in Universal Credit have increased significantly, from 6% to 13% between 2019 and 2022. As a result of this, the amount lost to fraud overpayment increased from £3.0 billion to £7.6 billion.33DWP. Fraud and Error in the Benefits System FYE 2022 estimates. 26 May 2022. Link.,34DWP. Fraud and Error in the Benefit System 2018-2019. 9 May 2019. Link. More importantly, the rate of loss has more than doubled, from 1.6% to 3.5%.35Ibid. If the net rate of loss in 2022 had been the same as in 2018-2019, the tax payer would have recovered £4.1 billion.
Benefit Fraud Rates
Government should aim to reduce its net overpayment loss between 2022-2023 and 2024-2025 to 2018-2019 levels. Government has already made provision for increased powers and recruiting 1,400 additional staff.36DWP. Fighting Fraud in the Welfare System. CP 679. May 2022. Link. If the net rate of loss were to fall to 2019 levels, it would save nearly £4.5 billion in reviewed benefits37Benefits reviewed in FYE 2022 were Universal Credit; State Pension; Housing Benefit; Personal Independence Payment; Employment and Support Allowance; Disability Living Allowance; Attendance Allowance; Pension Credit; Carer’s Allowance; Jobseeker’s Allowance; Incapacity Benefit. Link. in 2023-2024, and £4.8 billion in 2024-2025.
Reducing fraud to pre-pandemic levels would in itself generate billions in savings for the Government, and Government should target returning to 2018-2019 net cost rates next year and maintain these levels over the parliament.
3.3.2. Review of the Taxability of Benefits
Another area for reform that the Government should examine closely in the coming months to find savings is in relation to the application of income tax to benefits. Currently there are a range of benefits not subject to income tax. Government should commit to reviewing whether it is appropriate to continue these income tax exemptions, or abolish certain benefits altogether for higher rate taxpayers.
For example, the Winter Fuel Payment is a poorly targeted subsidy to those over pension age, which does little on its own to address fuel poverty. A report from the Environment Food and Rural Affairs Select Committee (2009) found that taxing Winter Fuel Payments for those on the basic rate of income tax and ending entitlement for those on the higher rate would save around 10% of total Winter Fuel spend.38In Thurley et al. Winter Fuel Payments Update. House of Commons Library. Briefing Paper CBP-6019. 5 November 2019. Link. From 2023-2024, this would save £200 million in both 2023-2024 and 2024-2025.
Alongside, an examination of benefits, Government must consider further reviews of tax reliefs that currently exist and which distort the overall taxation system. Some key examples include Business Asset Disposal Relief (Entrepreneur’s Relief), which does little to encourage investment, but which does result in Government foregoing £2.4 billion a year relative to taxing at the full capital gains rate.39Miller, Helen and Smith, Kate. Low rates of capital gains tax on business income lead to large tax savings but do not boost investment. 21 October 2019. Indeed, reform of Capital Gains has been strongly supported by the Office of Tax Simplification,40Office of Tax Simplification. Capital Gains Tax review – first report: Simplifying by design. November 2020. Link. and Nigel Lawson has noted that there is “little economic different between income and capital gains”.41Lawson, Nigel. House of Commons Debate: Taxes on Capital. Hansard. 15 March 1988. Link.
Ways to simplify the tax system will not all raise revenue either. One of the most significant ‘kinks’ in the tax system currently relates to Tax-Free Childcare, which is withdrawn automatically at £100,000. This creates an effective 97% tax rate , meaning that an individual with two children earnings £123,700 is only £760 better off than someone earning £99,000.42Cunningham, Alistair. The loss of free childcare: a 97% marginal tax rate. 2022. Link. Another kink in the system relates to the High Income Child Benefit Charge, which starts getting clawed back Child Benefit once one parent earns more than £50,000. The Child Benefit is meant to support families, but the current charge structure means that a family with two parents earning £35,000 receives a full child benefit while another family where one parent earns £55,000 and the other £15,000 would lose half of their child benefit entitlement. Making child benefit taxable for higher rate tax payers, rather than simply withdrawing it, would reduce this distortion.
Simplifying the tax code is a supply-side measures that makes the state more efficient and ensures a minimal number of distortions within the current system. When applied to benefits, it also ensures that money is spent where it is most needed, generating savings. Government should commit to a full review of taxability of benefits to, in particular, promote efficiency and growth, focus spending on those who need it most and to remove inefficient and counter-productive cliff edges within the system.
3.3.3. PIP and DLA spending
The state of the labour market remains one of the economic challenges facing the UK. This is reflected in both the rise in workless Universal Credit claims and the rise in spending on Personal Independence Payments. The rise in Personal Independence Payment spending is particularly concerning because of the rigorous process by which these claims are made and the fact that the PIP indicates a disability or long-term ill health.
In their latest annual report, the Department projected that, since 2017, spending on Personal Independence Payments would rise from £8.6 billion om 2017-2018 to £22.5 billion in 2024-2025. While this increase is accounted for in part by the shift from Disability Living Allowance to Personal Independence Payment, DLA is predicted to decline from £9.4 billion to £5.8 billion in the same period.43DWP. Annual Report & Accounts 2021-2022. July 2022. Link.
Combined PIP and DLA spending in 2017-2018 gives figures of £18 billion in 2017-2018 and £28.4 billion in 2024-2025.
DLA and PIP Spending
This charts a steep increase in long term ill-health which has reached 2.46 million people, the highest number on record.44Institute for Employment Studies. Labour Market Statistics September 2022. Link. Indeed, the rise in economic inactivity generally is being driven by an increase in the number of long-term sick, with the number rising from January-March 2020 to May-July 2022 by more than 3 million.45ONS, Table INAC01: Economic Inactivity: People aged 16 to 64 by reasons for inactivity. 13 September 2022.
The number of PIP clearances has risen in tandem. 536,770 claims were lodged between January 2022 and July 2022, compared to 351,617 in that same period in 2021 and 424,730 claims in 2019.46DWP, State Xplore. PIP Clearances.
The same pattern holds for jobless benefits in the UK too. Workless claims remain the highest they have been since 2012.47ONS. Data Tables For: Labour Market Overview, UK: September 2022. 13 September 2022
Workless UC and Jobseeker Claimants
In short, the labour supply remains an acute problem for Government, both by increasing DWP annual managed expenditure and by putting further strain on the labour market more generally.
DWP should look closely at its employment support schemes which have not always delivered value for money. To quote a Public Accounts Committee report on the Government’s Kickstart scheme,
the Department has not monitored and does not know whether it is putting the right people onto Kickstart, why people who are not taking up Kickstart jobs are not doing so, or what employers are providing with the £1,500 employability support grants awarded for each young person taken on through the scheme.48House of Commons Committee of Public Accounts. DWP Employment Support: Kickstart Scheme. 9 February 2022. Link.
One key problem for the Government’s programmes is that programmes like Kickstart and Restart were primarily focused on the long-term unemployed.49Jayanetti, Chaminda. UK government’s £2.9 billion job search scheme has put only 7% of participants in work to date. 5 June 2022. Link. However, the underlying problem now is around economic inactivity. Government should look to expand the Restart programme to those who have been signed off long-term sick and older workers who have become inactive. It should also in particular be linked up with those who have recently been awarded a PIP or other disability related payment, to ensure that these individuals get the support they need to maintain some form of work if they can.
3.4. Pensions: Link to Earnings not Inflation
The pensions triple lock has been a widely popular, but extremely costly Government policy. Increases in the state pension have significantly outstripped weekly earnings and mean that individuals in-work are now significantly more likely to report absolute low income than pensioners.
Between April 2010 and today, the value of the basic state pension for a single person has increased by 45%, while regular earnings have increased by 37%, and prices have increased by 35%.50ONS. Consumer price inflation time series. Monthly. April 2010-April 2022. Link. Pensioner poverty is now far less prevalent than it was in the 1990s, with only 14% of pensioners reporting absolute low income, compared to 19% of the general population.51House of Commons Library. Poverty in the UK: Statistics. 29 September 2022. Link.
Percentage of Pensioners on Absolute Low Income
Given the savings that need to be made in the current economic context, it would be unfair to impose the burden soley on those in the labour market, whose incomes have grown less sharply than pensioners and who would have faced the most significant economic dislocation during the pandemic. It is therefore reasonable for the Government to consider uprating pensions by earnings in the coming two years. By keeping pensions in line with earnings, the burden of the economic adjustment currently being experienced would also be shared more equally through generations.
Importantly, though, the Government could ensure that the poorest pensioners are supported by uprating Pension Credit by CPI. This way, the poorest pensioners would still receive an inflation-adjusted top-up. Moreover, Government could focus on ensuring that the 1.4 million pensioners who do not claim nearly £1.7 billion in Pension Credit access the support to which they are entitled.52DWP. Eligible Pensioners urged to claim Pension Credit to help with cost of living. 15 June 2022. Link.
Projected State Pension Spend
Projections based on assuming a 1.7% increase in pension population in 2023-2024 from ONS 2020 Interim National Population Projections, ONS figures for 5.5% earnings growth in May-July 2022, ONS Figures for 2023-2024 uprating 2024-2025 assumptions based on 1.8% increase in pensioner population, 2024-2025 inflation and earnings projections taken from Bank of England projections for earnings and inflation from the August Monetary Policy Report.
More broadly though, now is an opportunity to consider the role of pensions relative to earnings. When the DWP Select Committee examined this question in 2016, they argued that the Government should adopt a ‘smoothed earnings link’ – that is maintain the pension at a fixed level relative to overall earnings.
In 2021, the Basic State Pension (BSP) was approximately 18.9% of mean gross weekly earnings, the highest proportion is has been since the 1980s. The New State Pension (NSP) was, at £179.60, 24.7% of annual gross weekly earnings, just slightly lower than the peak state pension’s value relative to earnings (26% in 1979).53DWP Select Committee. Intergenerational Fairness. 2016. Link. These figures are in fact higher as a proportion of earnings than when the DWP Select Committee recommended moving to a smoothed earnings approach in 2016.54Ibid.
As such, Government could move to a model that ensures the pension closely tracks earnings over time, ensuring that as a proportion of total earnings the pension does not lose its value, and is maintained at a relatively high level by historic standards.
In terms of the savings that could be achieved over this parliament if the pension was linked to earnings, it would save £5 billion in 2023-2024 and nearly £11 billion in 2024-2025. In total, the saving would amount to £16 billion over the remainder of the Parliament.
Next chapter4. Public Sector Efficiencies
Tax as a share of GDP is at record levels. Yet despite this, there is a widespread view amongst the public that this investment is not being reflected in better public services. This is supported by performance metrics: whether in health, policing or the court system, delivery of core functions is frequently well below historical levels.
Accordingly, it is imperative that the public sector improves its efficiency – which must mean stopping doing some things, as well as doing other things better. Even if the Government sticks within the 2020 Spending Review settlement, the impact of inflation will mean a real terms reduction of £23bn in 2024-2555https://ifs.org.uk/sites/default/files/2022-10/Outlook%20for%20the%20public%20finances.pdf . Our view is that, in this scenario, the Government should not seek to simply maintain all budgets at their current level – an effective top-slicing of all budgets – but rather should actively identify savings and efficiencies, in order to allow some additional reinvestment in front line services such as the NHS, schools and policing.
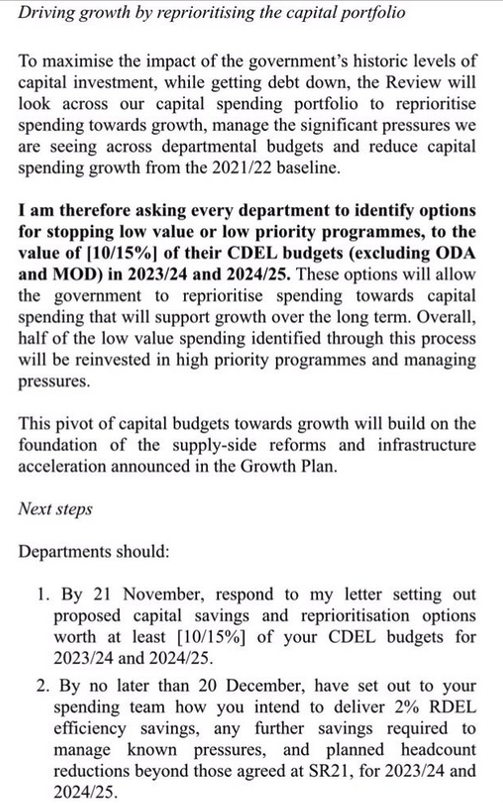
It has been suggested that the former Chancellor was intending to send a letter to all departments, seeking efficiencies of 2% of their Resource spending and 10-15% of their Capital spending (see extract of letter to right)56https://twitter.com/HarryYorke1/status/1581565640137052160?s=20&t=eGDb77abYVtHL2P4EDnmXw. It is possible that, after the leadership election, efficiencies at a higher level may be sought. Regardless of the precise amount, it is clear that any Government seeking to maintain fiscal responsibility must identify a number of efficiencies across all or most programmes.
In this chapter, we present a set of options for areas where efficiencies could be made. Some of these represent unnecessary or wasteful spending; however, other programmes have genuine benefits, but have been identified as lower priority programmes given the need to narrow the budget deficit without cutting front line services.
The Government has choices as to the balance between the actions it takes on taxation, welfare and energy; and on public sector efficiencies. If it is unwilling to retrench significantly on the energy package, to levy a windfall tax or to address major outlays such as the triple-lock, it will need to make additional savings from public services. Conversely, if it is willing tackle these issues, then fewer efficiencies will be needed. Given, however, the ongoing pressure on budgets being applied by inflation, whether it is a Conservative Government seeking to lower taxes, a Labour Government seeking to invest more in front line services or a Government of any party seeking to lowering the annual interest payments on our debt, reducing less productive areas of public spending must be a priority.
4.1. Transport
In most cases, investment in transport infrastructure should be protected, as an investment in the UK’s long-term growth. However, some major projects have been plagued by cost overruns and delays, with continued Government support being provided due to sunk-cost fallacies rather than based on a genuinely updated assessment of the cost-benefit or economic business case.
Just because a cost overrun has occurred does not mean that a project should automatically be cancelled. Crossrail overran its budget by approximately £3.8bn57https://www.london.gov.uk/sites/default/files/crossrail_-_project_at_a_glance.pdf , yet nevertheless constitutes a significant and important upgrade to London’s transport infrastructure. For this reason, decisions on whether or not to proceed or rescope should always be based on an up-to-date assessment of cost-benefit, taking into account the opportunity cost and wider economic climate.
High Speed 2 is one of the most prominent programmes that have been subject to cost overruns. In its conception HS2 was intended to increase capacity in the UK’s public transport, boosting regional growth and creating jobs. The project was intended to have three stages: phase 1 will connect London to Birmingham, and tunnelling work commenced for this part of the line in 2020. From Birmingham, the original intention was for a Y shape network, with one line going on to Crewe (phase 2a), and then furthers line going from Crewe to Manchester and from Birmingham to Leeds (phase 2b). However, the planned line to Leeds was dropped in 2021, with HS2 now planned to extend only as far as East Midlands Parkway, in addition to an extension after Crewe to Manchester.
One of HS2’s principal justifications – freeing space on the conventional lines for more commuter services – has been undermined by the likely permanent reduction in commuter rail demand post-covid. The estimated budget for the project has now shot up from an original figure of £55.7 billion in 2015 to over £100 billion, and it is reported that a new Government assessment finds that Phase 1 (London-West Midlands) will come in “many billions” above the £40bn target price. While too much has been invested in Phase 1 to cancel, the later phases are less committed, and may or may not continue to offer a positive cost-benefit. The proposed third runway at Heathrow is another project that has been dogged by delays since its inception, as well as frequently challenged by environmental groups. The most recent development in the legal situation was in December 2020, when the Supreme Court overturned a previous decision of the Court of Appeal, reinstating the Government’s Airport National Policy Statement and enabling new planning proposals to be considered58https://www.heathrow.com/company/about-heathrow/expansion . While the project itself will be privately funded, the lengthy delays create uncertainties for investors, and there may be consequential costs to the public purse for associated ground transport infrastructure.
The recent sharp increase in government borrowing costs will have a significant impact on the cost/benefit analysis of many of these projects by impacting the long-term return on investment. Changing patterns of travel post-pandemic, due to the increased prevalence of working from home, will also impact future projections of revenue. Particularly in a tightened fiscal environment, it is likely that some projects that had previously provided a positive cost/benefit outlook will no longer do so, or at least would need to be significantly be rescoped.
We therefore recommend that the Government undertake an immediate, rapid, assessment of all major transport projects, to assess whether each should be continued, rescoped or cancelled. The review should take no more than six months and should involve a range of respected, expert figures from a range of disciplines, taking into account the new fiscal and economic context, the shift in travel patterns and a proper assessment of political, legal and environmental risks that could contribute to further cost overruns.
4.2. Health and Social Care
The October 2021 Comprehensive Spending Review (SR) provided a cash uplift of £43.9bn in Department of Health and Social Care (DHSC) core resource spending from £133.5bn in 2019/20, to reach £173.4bn by 2024/25.59HM Treasury. Autumn Budget and Spending Review 2021. 27 October 2021 [Link] This was accompanied by a significant uplift in the DHSC capital allocation.
Spending at DHSC now substantially dwarfs any other department and has grown four-fold in real terms since the early 1980s. At the same time changing demographics in the UK, including an expanding and ageing population, is placing pressure on services. A citizen in their mid to late eighties consumes on average 10x the amount of hospital-based care as a citizen in their twenties. 60Nuffield Trust. The past, present and future of government spending on the NHS. 17 October 2022 [Link]
Given the financial picture across government, we have set out opportunities for reprioritisation and possible savings on headline DHSC budgets. NHS spending accounts for approximately 90% of the total RDEL and is the focus for this paper. We also consider the opportunities for savings within health and care ALBs and regulators, and the scope to increase revenue and reduce demand.
The NHS England budget over the SR period assumed:
- Providers would achieve an efficiency saving target of 5%. This equates to a total efficiency saving of around £5.6bn.
- The average pay award across the NHS would be approximately 3%.
- Inflation would be at 2%.
- A much-reduced COVID-related burden on the NHS, with estimated cost reductions of 57%.
The changing economic outlook since 2021 will have profound implications. The GDP deflator, which underpins Treasury analyses and is used to measure general inflation in the domestic economy, is expected to average 3.7% over the next three years.
Historically, health and care inflation pressures run above the GDP deflator. The biggest areas of impact for the NHS are pay settlements, alongside the rising costs of procuring goods and services. NHS England has estimated that this could result in a further £6-7bn per year in unanticipated costs.61NHS England Board meeting. 2023/24 financial position and the future financial outlook. 6 October 2022 [Link]
Alongside inflation, Covid-19 continues to play a higher than anticipated burden on the NHS and social care system. Daily patient bed occupancy due to Covid is higher in 2022 (9,743) than in 2021 (7,691) and 2020 (7,313), although the outlook has improved in recent weeks. Staff absences are also higher than in 2021. In response to upcoming winter pressures the Government chose to make £500m available to fund an Adult Social Care Discharge Fund for this winter.62Department of Health and Social Care. Our Plan for Patients. 22 September 2022 [Link] With performance against all NHS performance metrics in decline, attempts to review and reallocate resource must be undertaken with care. Seeking to bridge the anticipated gap in funding with further efficiency savings is unlikely to be viewed as credible. Indeed, over the next three years many areas of the NHS, from primary care to mental health, and social care system are likely to require funding to maintain basic standards of care that should be expected of developed healthcare systems. The NHS also significantly underinvests in capital as a proportion of its day-to-day revenue revenue and carried out £4bn in ‘capital to revenue’ transfers in the 2010s. Policy Exchange is therefore proposing that:
- All DHSC capital budgets are protected, with further emphasis on releasing surplus NHS land to fund additional capital spending.63The 2017 Naylor Review of NHS Property and Estates estimated that copmmercially executed disposals ofr NHS surplus land could generate £2bn-£5.7bn. We have modelled for this in our revenue assumptions at the end of the document.
- The current settlement for Health & Social Care agreed at the SR is retained, with reprioritisation from efficiencies within that settlement to the areas of highest priority.
Given inflation and higher covid-costs there nonetheless needs to be a discussion around the current revenue budget and where reprioritisation might be achieved. This is likely to require an assessment of options to reduce or reshape the focus of public services.64Paul Johnson and Ben Zaranko. Tory leadership candidates need to face reality on tax pledges. Prospect Magazine. 15 July 2022 [Link] There are no good options, only least worst options. We have outlined three below.
| Box 1: Cost of a prescription: £9.35 per item |
| Prescription prepayment certificate: £30.25 (three month) £108.10 (annual)
Prescription charging exemptions in England apply if you:
You also quality if you receive:
|
4.2.1. Reform prescription charges.
Patients in the NHS in England are charged £9.35 per item of prescription medication. Prescription charging acts as a subsidy, with those paying still protected from the full costs of medicine. Co-payment charges have a long and established history in the NHS. The introduction of prescription charges in the 1950s commanded cross-party support: the Labour Party legislated for the change in 1949, before being introduced in 1952 under a Conservative Government.
The scheme has become progressively more generous. Two thirds of the population of England qualify for free prescriptions by hitting one of the exemption criteria (see Box 1). As a consequence, 90% of all prescriptions are dispensed in the community free of charge. Once accounting for administration costs, the income received from charging for the remaining 10% is £600m per year. 65House of Commons Library. NHS charges. 6 January 2022 [Link] By comparison, the total cost for all prescriptions in England last year was £9.69bn.
The current arrangements make little sense and require reform.66Dame Kate Barker CBE. A new settlement for health and social care: Final report. 2014 [Link] This scheme was originally introduced to track the State Pension Age (SPA), which has risen to 66 and will become 67 for all those born after 1960.67Department for Work and Pensions. Second State Pension Age Review launches. 14 December 2021 [Link] The Government launched a consultation on aligning the upper age for exemptions with the SPA last Summer. It has yet to publish a formal outcome.68DHSC. Aligning the upper age for NHS prescription charge exemptions with the State Pension age. 2 September 2021 [Link] Achieving consistency between exemption and the SPA might raise a further £250m per year. A more fundamental overhaul of prescription charges would follow the recommendations in the 2014 Barker Commission, which was led by the King’s Fund (for example removing exemptions and replacing them with a cap to protect those on lower incomes and with long-term conditions).7 A simplification of the charging regime would enable the cost per item to be reduced or frozen at the current level, whilst at the same time raising in the region of £2-3bn per year for the Exchequer.
4.2.2. Direct enforcement of clinician-led review of low value NHS activity
Further decisions may need to be taken to manage financial pressure within the system. One option would be to address the commissioning of low value care – a priority for all healthcare systems.
Decisions on activities that should no longer be commissioned should be led by clinicians and focused on divesting taxpayers’ money from the lowest value care. One option would be to undertake direct enforcement of the existing and future waves of the Evidenced Based Interventions programme (EBI).69Academy of Medical Royal Colleges. Evidence-based Interventions [Link] The EBI programme was established in 2019 to improve the quality of care, by reducing unnecessary interventions and freeing up resources for use elsewhere in the system. The work is coordinated by the Academy of Medical Royal Colleges. Two earlier waves of the EBI identified 17 low value procedures and 31 low value procedures, respectively. Several procedures and diagnostics were then discouraged from being commissioned in the NHS, including surgery for snoring and exercise electrocardiogram (ECG) for coronary heart diseases – a diagnostic which was undertaken 45,000 times in 2018.
An evaluation of the first wave of the EBI found that clinical commissioning groups (CCGs) in England struggled to achieve divestment from low value care. Indeed, despite a third of CCGs volunteering to be part of the demonstrator community which trialled the first wave of EBI recommendations before implementation, there were no significant differences found between the volumes of low value procedures between demonstrator and non-demonstrator CCGs.70Anderson M, Molloy A, Maynou L, et alEvaluation of the NHS England evidence-based interventions programme: a difference-in-difference analysis BMJ Quality & Safety Published Online First: 07 April 2022. doi: 10.1136/bmjqs-2021-014478 In some demonstrators the quantity of low value care which was prescribed increased. This is concerning for clinicians who are the stewards of scare resources. NHS England had conservatively estimated that reduced activity across the 17 procedures would equate to a total saving of £200m per year.71NHS England, NHS Clinical Commissioners, the Academy of Medical Royal Colleges, NHS Improvement and the National Institute for Health and Care Excellence. Evidence-Based Interventions: Consultation Document. 2018 [Link]
The third wave of investigations commenced in 2022, with a final list expected in the coming weeks.
One option would be to enforce the implementation of these three waves, whilst also undertaking a fourth review which makes explicit the need to achieve financial savings, alongside assessment of whether existing interventions do not work or have been superseded by a safer alternative. This review could be expanded to include two additional areas:
Specialised services, where the costs have risen considerably in the past decade and are now more than £20bn a year. Examples include dialysis for chronic kidney disease, and specialist adult cardiology. Reforms in the way that certain specialised services such as the examples above are commissioned may create opportunities to move investment upstream to derive better value and reduce demand for specialised services in the future.72NHS England. Roadmap for integration specialised services within Integrated Care Systems. 31 May 2022 [Link]
Primary care medicines. The last guidance on ‘Items which should not be routinely prescribed in primary care’ was published in 2019 and identified medicines which had low clinical effectiveness or were low priorities for NHS funding. This wave identified 25 items at a total cost of £140m per year.
We estimate that this cumulative process across the three waves of the EBI and action on specialised services and the prescribing of low value medicines could yield savings of £1-2bn per year.
4.2.3. Shift spending towards interventions that generate good health and wealth
Ultimately the only way to reduce demands on the NHS on a permanent basis is to make our population healthier. Roughly two thirds of the people in inpatient bed days are filled with patients who are admitted due to preventable ill-health. Around half of all GP appointments are for preventable conditions. Tooth decay from poor diet remains the leading reason for hospital admissions among children aged 5 to 9 years.73Royal College of Surgeons of England. Hospital admissions for 5-9 year olds with tooth decay more than double those for tonsillitis. 19 September 2019 [Link] As discussed above, beyond the NHS there would also be significant economic multipliers; more than 300,000 people aged 15-64 have left the employment market in the past two years due to ill health.74John Burn-Murdock. Chronic illness makes UK workforce the sickest in developed world. Financial Times. 21 July 2022 [Link] We also know that the burden of illness is unevenly distributed and holding some communities back. Improving health is therefore an economic and social mission. As previous Secretary of State for Health and Social Care Rt Hon Sajid Javid said: “richer communities get healthier, and healthier communities get richer. Healthy people work more, learn more, and earn more”.75DHSC. Health and Social Care Secretary speech on Health Reform. 8 March 2022 [Link]
Our policy framework was originally designed around treating sickness. It must now change to one which promotes health. Take the example of type 2 diabetes, which the NHS spends £10bn a year treating. 90% of people with type 2 diabetes are overweight or obese.76Public Health England. Adult obesity and type 2 diabetes. July 2014 [Link] One option facing the Government would be to redirect 20% of this budget towards prevention, for example by expanding the existing NHS Diabetes Prevention Programme and through allowing GPs to prescribe anti-obesity medication for children and adults who are pre-diabetic. A recent trial found that one medication which targets hormones to reduce appetite led the average trial participant losing 15.3kg.77University College London Hospitals NHS FT. ‘Gamechanger’ drug for treating obesity cuts body weight by 20%. 11 February 2021 [Link] This will not be a panacea; the current NICE guidance is for a narrow set of severely obese patients with the treatment period capped at two years.78National Institute for Health and Care Excellence. NICE. Scientific evidence suggests that patient will gain weight if they stop taking the medicine. Therefore, pharmacological interventions of this type would be optimally combined by interventions including exercise regimes and intensive coaching, combined with actions which shape the wider and ‘commercial determinants of health’ for example by boosting the choice and availability of healthy food in supermarkets, convenience stores, schools and other settings.
Reallocation of existing budgets would be controversial. Current patients with type 2 diabetes might experience longer waits for treatment, such as amputations or treatment for diabetes-related sight loss. In return however, the growth in the number of new diabetes patients would be expected to slow, as prediabetic patients lose wight and improve their overall health. With the Government’s desire to both achieve fiscal restraint whilst boosting the proportion of the working age population in good employment, interventions of this kind will be amongst the most impactful.
It is important to acknowledge that this intervention would be unlikely to see significant savings within the Spending Review period. The Treasury has traditionally viewed ‘spent to save’ arguments with scepticism. Some of this is legitimate. But recent evidence shows that prioritising short-term savings in the NHS does increase costs in the longer term. The new Prime Minister will face a decision on whether to push the difficult choices onto future generations or to take the steps now to safeguard public services by reducing the demand for health and care over the longer term.
4.3. Department of Work and Pensions
The DWP budget accounts for more than a third of annual managed expenditure. With pensions and benefits discussed in Taxation, Welfare and the Energy Package, above, this section focuses upon DWP’s programme budget, which is comparatively small: total Resource DEL is only £8.1 billion, or 1.7% of total resource DEL spending.
Given the state of the labour market – with rising levels of inactivity coupled with low unemployment79Institute for Employment Studies. Labour Market Statistics, September 2022. September 2022. Link. – the Department has significant policy challenges. It would therefore not be wise to cut the programmes already in place given the state of the labour market and lowest recorded levels of consumer confidence.80GfK. Consumer Confidence down two points to lowest-ever score of -40. 20 May 2022. Link. Furthermore, the inflationary pressure and threat of recession in the economy vitiate against any real terms cut in benefits.
We therefore recommend the principal savings that should be considered is to capital DEL, where the Main Estimates project net spending of £853 million, 42% above the CSR baseline and also significantly above inflation81HM Treasury. Central Government Supply Estimates. HC 396. 23 June 2022. Link.. Government could reduce capital DEL this year by £200 million and maintain the same investment in real terms as the CSR. Government should thus defer £100 million in capital spending until the end of this parliament and spread the other £100 million over the next two fiscal years. This would generate a saving of £100 million over this spending review period while also protecting capital DEL over the next two years from inflation increases.
4.4. Home Office and Policing
As the Home Office states, “the first duty of the government is to keep citizens safe and the country secure”82Home Office Website, link. Based on current levels of illegal immigration, the public’s derisory level of confidence in policing and the huge backlog in the criminal courts system it is apparent that successive governments over the last decade have failed to achieve this most fundamental of duties. While the current fiscal position requires savings to be identified across government spending, it is essential that frontline policing, border and immigration enforcement, counter-terrorism and the wider criminal justice services are protected from budget cuts.
We propose three areas where efficiencies should be sought.
Increase in usage of community-based sentencing including Deferred Prosecution Arrangements, Home Detention Curfews and Community Payback programmes:
The current backlog in the criminal courts has reached proportions previously unseen. In the year leading up to the Covid-19 pandemic, the number of outstanding cases in the Crown Court increased by 23%, from an all-time low of 33,359 in March 2019 to 41,112 in March 202083Ministry of Justice, Criminal court statistics quarterly, January to March 2022, link. Since the pandemic the number of outstanding cases reached 59,917 in March 2021, reducing slightly to 58,653 by March 202284Ibid. Between March 2019 and March 2022, the number of cases waiting longer than a year to conclude had increased nearly six-fold, from an all-time low of 2,639 cases to 15,58085Ministry of Justice, Criminal court statistics quarterly, January to March 2022, link.
Maximising the alternative sanctions to those which are implemented by the criminal courts for those who have committed non-violent offences could contribute to a significant reduction in the courts backlog and a significant cost saving. The Turning Point (NW London) ‘Deferred Prosecution’ programmes recently trialled in North-West London has to date demonstrated significant success in preventing re-offending. Young people joining the programme went on to receive 58% fewer criminal charges than those who were charged or received a police caution – a significant reduction in the likelihood of reoffending86K. Harber & E. Neyroud (2022), Turning Point (NW London): Interim Findings Report (1). Notably there was no detrimental impact on victim satisfaction. Those who failed to comply with the community-based requirements were then prosecuted to the full extent of the criminal courts. Although a moderate investment would be required (estimated at an annual spend of £10m for roll-out across London87Based on approximate salary costs for community supervision officers and estimated case loads for roll out of the programme.) to ensure that those entering the programme were suitably monitored in the community this could be offset by a far more significant saving to the courts budget by the programmes’ widespread roll-out.
Once individuals have been dealt with by the courts there is a broad range of sentencing options for those convicted. This includes fines, community-based sentencing such as Home Detention Orders and unpaid work requirements through to terms of imprisonment. Evidence suggests that prison sentences of under 12 months, without supervision on release, are associated with higher levels of reoffending than sentences served in the community88G. Eaton & A. Mews (2019), The impact of short custodial sentences, community orders and suspended orders on reoffending, Ministry of Justice Analytical Series. The replacement of short prison sentences with community orders could lead to 32,000 fewer proven reoffences per year. Two options to deliver this would be (1) an expansion of the use of Home Detention Orders in order that those sentenced to less than 12 weeks imprisonment could instead serve those sentences under a Home Detention Order, and (2) an expansion of the Community Payback model in order to increase the length of unpaid work programmes beyond the current 300 hours as an alternative to custody.
A shift to reduce the number of short-term prison sentences to an increase in sentencing completed in the community could reduce the need for the currently planned additional prison places. Although the government has committed to providing an additional 20,000 places and an additional six prisons, this could be reduced. By delaying the building of one of the new prisons this could lead to a significant capital cost saving (estimated at £0.5billion) in addition to significant ongoing resource expenditure savings.
4.4.1. End the Police Officer Initial Training Degree Requirement
The initial training of police officers has been the subject of significant change over recent years. The principal changes have been as a result of the introduction of the Policing Education Qualifications Framework (PEQF) – a new training framework and curriculum introduced by the College of Policing89College of Policing, Policing education qualifications framework, link. Through one of a number of different routes, new police officers are now required to develop operational policing skills at the same time as they obtain an academic policing qualification with a university. As the number of officers joining the police service through the PEQF has increased, concerns over the framework have also increased. It is now a view held by many within policing that the implementation of the PEQF is having a potentially negative impact on forces’ ability to serve the public. There are also concerns that moving to a graduate-only police force will be socially divisive and run contrary to the widely accepted maxim that, in a society that operates policing by consent, a police force should reflect the wider society it polices. Accordingly, we recommend that the initial training degree requirement of the PEQF should be abolished
In future years, in order to retain police officer numbers at the number projected once the Police Uplift Programme has been completed, it will be necessary for police forces to recruit and train approximately 7,000 police officers per year. The approximate cost difference between the pre-existing Initial Police Learning and Development Programme and the new PEQF programme is approximately £7,000 per recruit. By removing the university accredited degree element of police recruit training approximately £50million a year can be saved from police budgets.
4.4.2. Policing Priorities
As set out in our recent report, Policing can Win90https://policyexchange.org.uk/publication/policing-can-win/, recent polling in the UK found that, “the public were almost twice as likely to agree than disagree with the statement that ‘the police are more interested in being woke than solving crimes’. While this may be a grossly unfair distortion of what police officers engaging with the public are attempting to achieve at the policing of public events, the potential prominence of this perception is reflective of the scale of the challenge for modern policing. There should be a consistent prioritisation across all police forces of tackling crimes in the real world – including burglary, violent crime and sexual assault – and not engaging in gesture politics or spending time policing twitter.
One specific area of concern is the recording of so-called ‘Non-Crime Hate Incidents’, which have caused the public considerable concern that they are causing a chilling effect on the freedom of speech91Miller v College of Policing, [2021] EWCA Civ 1926. It also increases costs, as the rules set out for Home Office Counting Rules in the 367-page guidance document impose a significant bureaucratic burden on police forces and officers92Ibid. They also fail to provide an accurate picture of crime to the public, particularly given that for most offence types there are other more accurate sources, such as the Crime Survey of England and Wales.
A less burdensome system should be developed which provides sufficient assurance to victims of crime and a more realistic picture of crime to communities. By simplifying the HOCR considerably including reducing the threshold for the recording of Non-Crime Hate Incidents, efficiencies within policing could be created by reducing or eliminating the considerable bureaucratic industry which now exists in recording, enforcing and auditing what is an unnecessarily complex process.
By reducing the bureaucracy inherent in administration of the Home Office Counting Rules, and ‘Non-Crime Hate Incidents’ this would have the potential to either free up considerable police time or derive cost savings from existing police budgets, halving this element of these functions could lead to at least a £10m saving from police budgets93There are 500 officers and staff currently posted to the Crime Recording Investigation Bureau in the Metropolitan Police Service, a proportion of whom will be focused primarily on audit rather than investigative functions. The calculation presumes 20% of these are focused on audit rather than investigation..
4.5. Education
The Department for Education’s Spending Review Settlement sets out that total DEL will rise £86.7bn, from an outturn of £68.4bn in 2019-2094https://www.gov.uk/government/publications/autumn-budget-and-spending-review-2021-documents/autumn-budget-and-spending-review-2021-html#departmental-settlements. Of this, the core schools settlement accounts for £56.8bn, or approximately 65%, and capital another £6.1bn. Outside of its SR settlement, DfE is also responsible for the Higher Education Student Loan system, where recent changes to borrower terms and conditions delivered a £35bn saving to the Exchequer over the six years covered by this year’s Spring Statement95https://www.gov.uk/government/publications/spring-statement-2022-documents.
In headline terms, the financial position for schools remains strong, with funding per pupil only slightly below, in real terms, that in 2010, which itself had followed a decade in which real-term spending per pupil had grown at an average rate of 5% a year96https://ifs.org.uk/sites/default/files/output_url_files/R115.pdf. Schools also received a significantly above-inflation three-year settlement in 2019 and additional one-off funds over the pandemic, including £5bn in COVID catch-up funding and schools, like businesses, will receive support from the Energy Bill Relief Scheme. Nevertheless, significant challenges remain, including pay increases higher than anticipated at the time of the SR as well as broader inflationary pressures, which will lead to some individual schools facing significant challenges.
Outside of schools, the further education and adult skills budget has faced significantly more challenges. Funding per pupil for 16-18 year olds fell by 11% in real terms between 2010-11 and 2020-2197https://ifs.org.uk/publications/further-education-and-sixth-form-spending-england and spending on adult further education has fallen by approximately 2/3 since 2003-498https://researchbriefings.files.parliament.uk/documents/CBP-9194/CBP-9194.pdf. The Children’s Social Care budget also faces significant challenges, as identified in the McAllister Independent Review of Children’s Social Care99https://childrenssocialcare.independent-review.uk/.
4.5.1. Schools
We recommend that the overall core schools budget should remain at the level set out in the Spending Review; however, within this, there are significant efficiencies that could be made in order to use these funds more effectively.
Between 2003 and 2017, the overall real terms increase in expenditure per pupils was 42%100https://epi.org.uk/publications-and-research/understanding-school-revenue-expenditure-part-4-long-term-trends-in-expenditure-on-teaching-staff/. This headline figure, however, conceals significant variation between types of expenditure. Expenditure on educational consultancy increased by 196%, on catering by 184% and on education support staff increased by 138% and on back-office functions by 102%101https://epi.org.uk/wp-content/uploads/2019/09/EPI-School_Expenditure_1.pdf. Meanwhile, expenditure on teaching staff increased by only 17%, and on learning resources by 23% (non-ICT resources) or 17% (ICT resources)102Ibid.. Given that the Education Endowment Foundation has found that ‘teachers are the most influential within-school factor in determining children and young people’s academic attainment’, this seems a mismatch of funding against priorities103https://educationendowmentfoundation.org.uk/support-for-schools/evidence-guardianship.
For example, the rate of increase in teaching assistants and wider education support staff has been exceptionally high over the last two decades, with 15p in every pound now spend on education support staff. The expenditure per pupil on education support staff increased by 138 per cent in real terms between 2002-03 and 2016-17, a rate of increase eight times higher than the rate of increase in expenditure on teachers104https://epi.org.uk/publications-and-research/understanding-school-revenue-expenditure-part-5-expenditure-on-teaching-assistants/. The number of teaching assistances has also trebled since 2000.
The Department for Education should work with schools to reduce funding on matters such as educational consultancy and back-office functions, redirecting funding towards teaching staff. The case of education support staff is more complex, but also demonstrates capacity for efficiencies. Although the commitment and dedication of individual teaching assistants is beyond question, studies by the Education Endowment Foundation have found that although teaching assistants, if deployed correctly, can boost pupil attainment, in many schools in England, teaching assistants are not being used in ways that improve pupil outcomes105https://educationendowmentfoundation.org.uk/news/new-eef-guidance-report-making-best-use-of-teaching-assistants. It is therefore likely that, in many schools, funding used to support teaching assistants can be used more effectively. If we assume, conservatively, that 1/3 of education support staff can be allocated more effectively, this would represent a saving of £2.8bn that could be reallocated within the schools budget.
Finally, the High Needs Block of school funding, used for the support of pupils with Special Educational Needs, has increased by 28% since 2019-20, having received cash-terms increases of c. 10% year on year, a rate of increase that is anticipated to continue106https://researchbriefings.files.parliament.uk/documents/CBP-8419/CBP-8419.pdf. Accordingly, this budget line is taking up an increasingly large portion of the core schools budget. We therefore recommend that the Government consider holding the High Needs Block to the same rate of increase as the Core Schools Budget for the rest of the Spending Review period.
4.5.2. Skills and Higher Education
Given the significant reductions in funding over the last two decades, we do not recommend reducing the core 16-19 or adult education budgets. There is, however, the potential to find efficiencies within programmes that are not fulfilling their potential. The £560m adult numeracy programme, Multiply, has yet to begin significant on the ground delivery; meanwhile, the traineeship programme, for which a further £111m was announced in 2020107https://www.gov.uk/government/topical-events/plan-for-jobs, was originally designed for a high-unemployment economy, the opposite of the current circumstances. We recommend that Government could consider finding efficiencies of £200m – £300m across these two programmes.
In Higher Education, the majority of support is via the student loan system, where repayment thresholds and loans are currently frozen until the 24/25 academic year. Government should consider freezing these for a longer period, until such time as debt is falling as a share of GDP. £1.6bn annually is also allocated through the Strategic Priority Grant process108https://www.officeforstudents.org.uk/media/eea64c40-100d-4249-af07-cb3645f51d9b/funding_for_2022-23-_ofsdecisions.pdf. Savings could be considered from High Cost Subject Funding Price Group C1.2 (£18m) (which currently means that universities receive a higher per capita funding for students studying media studies or creative arts than they do for students studying mathematics or languages); from the Overseas Study Programme (£28m); they could also be considered from UniConnect (£30m), or from a 20-30% reduction in the full-time and part-time Premium to Support Successful Student Outcomes lines (collectively £211m) as these activities should be funded directly by universities through their Access and Participation Agreements; or alternatively from the Capital Funding allocation (£150m). Collectively, £150m – £250m could potentially be saved from these programmes.
Finally, Government should implement a Minimum Entry Requirement of either EE or EEE for entry to a Level 6 (undergraduate degree) course, with exemptions for mature students or for those who have done an enabling course, such as a foundation year or an Access to HE course. This would also have the benefit of ensuring that those who progress to HE can genuinely benefit from it. A cap set at EE would impact approximately 1% of the Level 6 population, saving £300m in student loan outlay in steady state109Author calculation based on figures in the below, assuming a three-year degree. https://assets.publishing.service.gov.uk/government/uploads/system/uploads/attachment_data/file/1057091/HE_reform_command-paper-web_version.pdf.
4.6. The Civil Service and Arm’s Length Bodies
It is always possible to introduce efficiency savings across Whitehall. The Coalition Government, under Lord Maude, then The Minister for the Cabinet Office and Paymaster General, saved taxpayers more than £50 billion through efficiency and reform savings.110link Indeed, more than £3.4 billion was saved in 2020/21 through successful efforts to improve efficiency across Whitehall. This included £1.8 billion through cutting losses from fraud and debt and £1.4 billion through improved buying decisions and £142 million through more effective use of digital services.111link
The Government’s 2021 Spending Review (SR21) was predicated upon the delivery of 5% savings against day-to-day central departmental budgets in 2024-25.112link In addition, with inflation running more highly than expected in 2021, further efficiency savings will have to be made if departmental budgets do not rise in line with inflation.
However, it is also essential to ensure that any plans to improve efficiency do not inadvertently shunt costs to other parts of government, or have the unintended consequence of reducing service quality. This can often increase the overall cost to the government as a whole, even if it appears as a saving for a department. For example, the National Audit Office found that the Ministry of Justice’s reforms to civil legal aid unexpectedly increased the number of ‘litigants in person’, which raised the cost of processing cases, with estimated net costs of £3 million per year to HM Courts & Tribunals Service as well as direct costs to the Ministry of Justice of approximately £400,000.113link
We propose five areas where further efficiencies should be made:
Headcount reductions:
- Reform to ALBs
- Reduction in consultancy spend
- Equality, Diversity and Inclusion
- Modernisation and reform
4.6.1. Headcount reductions
Civil service headcount rose from 384,000 in June 2016 to 479,000 in March 2022.114link In June 2022, the Johnson Government committed to reducing the size of the Civil Service by 91,000 by 2025, with the aim of saving £3.5bn a year.115link The 91,000 target, which has since been scrapped albeit not formally, was agreed outside of the March 2022 spending settlement. However, it is unclear whether this target remains extant.116link Regardless of whether it has a formal target of 91,000 or not, we consider reducing the number of civil servants to pre-pandemic levels to be an appropriate ambition.
Around 40,000 civil servants leave their jobs each year, meaning the implementation of hiring freezes might allow the government to avoid the cost of compulsory redundancy payments, reported at being around £6-7 billion.117link Such freezes have already been introduced by both the Home Office and the Department for Environment, Food and Rural Affairs (among others).118link However, solely relying on this method would result in a disproportionate departure of high performers. It is essential that voluntary redundancy schemes target poor performers, and that departments actively reshape departments to focus on core priorities. For example, the 2012 review of the Department for Education found that “around 20% of the Department’s current work is strictly mandatory, in the sense of being required by legislation or contractual obligation” and that “the other 80% is discretionary and is driven by Ministerial priorities and historic commitments.”119link
Furthermore, it is important to remember that reforms that might make Whitehall more effective can involve the recruitment of large numbers of staff. The best example of this is measures to fight fraud. The Department of Work and Pensions, one of the three departments (alongside the Ministry of Justice and the Home Office) that have experienced the largest growth in the number of officials since 2016, has recently pledged, rightly, to hire a further 1,400 staff in in its counter-fraud teams and to establish new 2,000-strong team dedicated to reviewing existing Universal Credit claims at a cost of £613.0 million.120link These hiring proposals are estimated to save taxpayers £2 billion of loss in fraud and error over the next three years and over 4 billion over the next five years.121link
There are three specific areas where cuts to headcount should take place, regardless of whether there is a formal target or not. First, as Policy Exchange has argued, the Government should radically overhaul the Government Communications Service (GCS). At present, the Government Communication Service employs over 7,000 people across 25 ministerial departments, 21 non-ministerial departments and over 300 agencies and other public bodies. The Service suffers from an unclear command structure and is disproportionately focused on traditional print media over digital communications. Press operations should be capped at 30–40 members per department. Furthermore, as recommended in the Maude Review of the cross-cutting functions, “the Head of GCS should run an assessment and accreditation programme — a licence to practice — and better incentives for communications specialists to progress.
Second, the Government should explore cutting the number of those working in the policy profession. As the Institute for Government has pointed out, “since March 2016, just before the EU referendum, the policy profession has grown by 11,720 staff – an increase of 71%.”122link As they go on to argue, this is more than twice the next largest growth in staff, in the project delivery profession, which increased by just 5,030 civil servants.123link Whilst it is right to argue that Brexit did create a need for more policy professionals, arguably the policy profession has grown too greatly.
Thirdly, as set out in the case studies in this section, there is a strong overlap in the responsibilities of many civil service departments and arm’s length bodies. This frequently includes the duplication of policy teams, as well as communications, HR and other central functions. Either merging or reducing the number of arm’s length bodies (see below), or the reduction of duplication, offers significant scope for savings.
| Case Study: Home Office and Ministry of Justice |
| Both the Ministry of Justice and the Home Office should be required to reduce their ‘headquarters’ headcount at least to the levels they were at the start of June 2016. These reductions should be found entirely from ‘headquarters’ functions and not from frontline agencies or services. Where there are roles which duplicate the same or similar policy areas across the ‘headquarters’ function and the ‘agency’ function, the ‘agency’ function should take priority. For example, in the case of the MoJ and HMPPS the ‘prison education’ team in the MoJ team should be closed in its entirety with the policy work undertaken solely by HMPPS. In every case efforts should be made to push policy making functions as close to the point of service delivery as possible.
A similarly indefensible position exists relating to the Home Office’s consultancy spend which has grown over the period 2019/20 to 2020/21 from £25.3m to £67.1m124 Home Office, Annual Report and Accounts 2020-21, link . It is difficult to see how an organisation the size of the Home Office, with over 35,000 employees must also spend such a significant sum on external consultancy. This budget should be reduced significantly. |
We also recommend that the Government should launch a new pilot scheme to assess the capabilities of government departments. There is historical precedent for such a scheme, most notably the Civil Service Capability Review programme which was established under the Blair Government. The Civil Service Commission should deploy a panel of experts (such as former permanent secretaries, economists, former ministers, and others) to evaluate all of the output of every business unit in a department over a period of three months. This exercise would evaluate the quality of submissions and advice, track the implementation of decisions, and evaluate the professional competency of each business unit. The results of this audit should be used to inform decisions about headcount reductions within a Government Department.
Overall, reducing the civil service to pre-pandemic levels would result in a structural saving of £3.5bn, though not all of the net savings would be realised within this Spending Review.
4.6.2. Reform of Arm’s Length Bodies
Arm’s length bodies now spend over £220 billion a year and employ over 300,000 people. Following the belated launch of the Public Body Review Programme in 2022, the Government has committed to savings to Resource Departmental Expenditure Limits (RDEL) of ALBs of more than 5% in nominal terms as of 22/23.125link Furthermore, the Government should ask non-departmental public bodies (NDPBs), which are presently exempt from the formal target to cut civil service headcount, to produce proposals to cut their headcount by 10%.
The Public Bodies Transformation Programme, which ran from 2016-2020, has been a complete failure. As part of the programme, every single Arm’s-Length Body (ALB) was supposed to undergo a so-called ‘tailored review’. Only 101 (or 34%) of the 295 planned reviews actually took place. As the NAO has pointed out, even those which did happen “lacked a consistent approach”. By comparison, the Public Bodies Reform Programme from 2010 to 2015, widely regarded as the most successful public bodies reform programme since 1997, reduced the number of public bodies by a third (from 904 to 610) and reduced their administrative spend by a cumulative £3 billion.126link
We recommend that:
- The Government completes a review of every single public body by the end of the programme. Each department’s Outcome Delivery Plan should include a timetable outlining how they plan to review each ALB sponsored by the department.
- All NDPBs should be required to reduce their headcount by 10%. Whilst it is unclear whether the Government still has a target to reduce Civil Service headcount by 91,000, NDPBs are currently exempt from this cut. The Government should ask NDPBs to model cuts of 10%.
- The Government should establish a dedicated central unit that can complete evaluations of Arms-Length Bodies on instruction from sponsoring departments. Whilst the Cabinet Office can provide advice and challenge to departments, sponsoring departments are responsible for undertaking reviews of ALBs. As a result, the standard of evaluations differs across government departments.
| Case Study: Reducing duplication across NHS England and DHSC |
| DHSC and its Arm’s Length Bodies together cost £2.8bn to run each year.127 Speech by Rt Hon Steve Barclay, former Secretary of State for Health and Social Care to Policy Exchange, 1 September 2022 A majority of this is staff costs in DHSC and NHS England, alongside £600m in annual estate costs. When first created following the Health and Social Care Act 2012, NHS England was envisaged by the then Secretary of State for Health to be a ‘lean’ organisation of a few hundred employees.128Department of Health. Equity and excellence: Liberating the NHS. White Paper. July 2010 [Link] The latest figures show that NHS England has nearly 11,000 full time staff.129Department of Health and Social Care: workforce management information 2012-2022 [Link]A further 1,500 roles are within the NHS Trust Development Authority and Monitor (collectively known as NHS Improvement).
Such growth would be justifiable had there been a significant transferring of functions from the Department. However, analysis of workforce data shows that the number of full-time equivalent employees at DHSC has increased by 72% in the past decade.130In June 2012 the total FTE headcount within DH was 2,273. By June 2022 this had risen to 3,919. By comparison, the number of front-line clinical nursing and doctor roles and in-provider managerial roles have increased by 20% on average in the past decade.131Nurses includes health visitors and midwives. NHS Managers are those working at a provider level and excludes central functions. Good management is essential for the running of any public service. Indeed, evidence shows that the NHS is relatively under-managed compared to other parts of the economy.132 Ian Kirkpatrick and Becky Malby. Is the NHS overmanaged? NHS Confederation. 24 January 2022 [Link] There is a compelling case to invest in and increase the quality of management within hospitals, primary and community care, especially in geographies which experience worse outcomes.133General Sir Gordon Messenger and Dame Linda Pollard. Health and social care review: leadership for a collaborative and inclusive future. 8 June 2022 [Link] This should ensure that the right skills are in place to improve efficiency and productivity on the front line. Policy Exchange has previously argued that growth in the size of the centre can no longer be justified.134 Robert Ede and Dr Sean Phillips. Devolve to evolve? May 2022 [Link] A consolidation of Arm’s Length Bodies is underway with NHSx, Health Education England and NHS Digital being subsumed within NHS England in April 2023. This follows the merger of the NHS Improvement functions within NHS England from 1 July 2022. Between 30-40% of roles are anticipated to go. Once this process is complete, NHS England and its regional teams will still have 14,000 staff.135HCSA. 6,000 plus jobs to be cut at ‘new NHS England’. 8 July [Link] The operational independence of NHS England has been highlighted as a strength of the HSCA 2012 in reducing ‘political interference’ in the NHS. However, a health and care system organised around integrated care should be embracing interdependence, not independence. There is evidence that the current approach creates friction, with first-hand reports of duplicative policy working, and inadequate transparency and data sharing between the Department and NHS England.136Bill Morgan. The NHS needs major structural change, but there’s cause for optimism. The Times Red Box. September 2022 [Link] Other commentators have suggested that the complexity of activities undertaken within NHS England creates a culture within the NHS to ‘look upwards’ and makes it difficult for the Department to be an effective sponsor and scrutiniser of its work.137 Ham, C. Governing the Health and Care System in England. NHS Confederation. 2022. [Link] This suggests both a strong organisational and financial case for reunification. Choosing to bring NHS England back within the Department, whilst retaining a separate board and management, would enable consolidation of policy, back-office functions, and estates. This could be combined with a review of the cost of regulators within health and care, where there are 10 different service regulators and 8 different regulators of the health professions.138Policy Exchange. Re-engineering Regulation: A Blueprint for Reform. 2022 [Link] Within five years we estimate it would save up to £1bn a year. |
Reduction in Consultancy Spend
In 2021 alone, over £2.5 billion worth of consultancy contracts were awarded by public bodies. This was a record high.139link
The Government’s use of consultants has increased over recent years for two reasons:
- Brexit: The NAO discovered that the minimum expenditure by departments on Brexit consultancy was £97m. It also found that departments did not meet “the standards of transparency expected by the government when publishing details of contracts for EU Exit consultancy.”140link As Tussell have demonstrated, from 2017-18 to 2019-20, the Home Office saw a 788% increase in spending with major consulting firms, MHCLG saw a 637% increase and DWP saw a 564% increase in its use of consultants.141link
- COVID 19: Between March and August 2020 alone, a total of 106 contracts worth £109m were agreed between various government departments and consulting firms such as PwC, Deloitte and McKinsey.
Given that the UK has both left the EU and that the UK has successfully rolled out a COVID vaccine programme, the two major drivers for the use of consultants and professional services have abated. The Civil Service’s overreliance on external contractors and consultants must be addressed. Not only is the use of such contractors expensive, but it also deprives public servants of the opportunity to work on the most challenging and fulfilling policy issues. From 2010-2012, consultancy spend was reduced by over 85%, demonstrating that reductions are possible.
The Government should aim to cut the value of consultancy contracts by 50%. delivering £1.3 billion of saving. Central controls over departmental consultancy spend must be exercised more forcefully. In line with the recommendations in the Maude Review of the Cross-Cutting Government Functions, thresholds should be changed and set at the following levels:
- £100,000 OR a 3-month contract for sign-off by the Minister in charge of the department
- £500,000 OR a 9-month contract for Minister for Efficiency sign-off.
4.6.4. Equality, Diversity and Inclusion (EDI)
The Equality Hub is the department of the Government that is responsible for social equality. It was formed in 2019 to bring together the Government Equalities Office (GEO), the Disability Unit (DU), the Race Disparity Unit (RDU) and the Social Mobility Commission (SMC). The Equality Hub moved to the Cabinet Office in April 2019 with the strategic goal of putting equalities at the heart of Government.142Government Equalities Office, GEO Strategic Plan 2019/20 https://assets.publishing.service.gov.uk/government/uploads/system/uploads/attachment_data/file/814357/GEO_Strategic_Plan_080519_.pdf (Accessed 5/10/22). There is little official government documentation that specifies the expenditure of the Equality Hub. However, while the Equality Hub was established to streamline the three separate equality units (joined by the fourth – the SMC – in 2021), according to publicly available government correspondence, the projected expenditure for 2022 has increased 12.7% from 2019 (from £16.5mn to £18.6).143Equality Hub, https://committees.parliament.uk/publications/7976/documents/82339/default/ (Accessed 6/10/22). As of November 2021, the Hub employed 161 FTE employees deployed across the components.144Ibid. This should be reduced to 2019 levels in cash terms, saving £2m.
However, significant amounts of public sector time spent working on EDI takes place in Government department. This includes a significant number of staff working in equality and diversity teams; for example, a recent advertisement for the Home Office (c. 36,000 FTE145https://www.gov.uk/government/publications/workforce-management-information-2022) suggested that this department employs a team of 20146Deputy Director, Diversity & Inclusion Reform, https://www.civilservicejobs.service.gov.uk/csr/index.cgi?SID=b3duZXI9NTA3MDAwMCZqb2JsaXN0X3ZpZXdfdmFjPTE4MTM4Mzcmc2VhcmNocGFnZT0xJnBhZ2VjbGFzcz1Kb2JzJnVzZXJzZWFyY2hjb250ZXh0PTEyMzA4OTA5JnBhZ2VhY3Rpb249dmlld3ZhY2J5am9ibGlzdCZvd25lcnR5cGU9ZmFpciZzZWFyY2hzb3J0PXNjb3JlJnJlcXNpZz0xNjY1NDE1NzE4LWU0ZjVlM2ZmNzMwMWE0OTJlNDQxMmU1ZjcxYWJiYWE5MzcxMzUwNjQ= (Accessed 12/10/22).; the Department for Education (c. 7,000 FTE) is understood to have employed six staff working on EDI in the first half of 2022147Evidence from former DfE employee.. Assuming one diversity officer for every 1000-2000 people, it is likely there are between 200 and 500 EDI officers working across Whitehall.
This, however, significantly underestimates the corporate time spent on EDI. In many departments, staff are required to undertake mandatory diversity training, including courses which have been shown to have little or counter-productive impact, such as ‘unconscious bias’ training148https://www.telegraph.co.uk/news/2022/02/12/civil-servants-subvert-sabotage-ministers-defying-order-scrap/. The cost of this is less significant than the staff-time that is consumed. Departments typically have a number of diversity networks, comprised of staff volunteers, who are permitted to spend some of their contractual time (often 10%) working on diversity matters, and which sometimes receive grants from the department. These networks often receive preferential access to influence HR Departments and other senior managers. This is in addition to and outside the formal structures of union-based ‘facility time’ which have historically been used to effectively manage such issues. The Taxpayer’s Alliance also reports that there were 327 public sector organisations paying membership to LGBT charity Stonewall’s Diversity Champion programme in 2021, costing over three million pounds worth of public money.149The Taxpayer’s Alliance, Stonewall subsidy: Diversity Champions scheme, August 2021 https://d3n8a8pro7vhmx.cloudfront.net/taxpayersalliance/pages/17336/attachments/original/1628152391/Stonewall_subsidy_-_Diversity_Champions_scheme.pdf?1628152391 (Accessed 6/10/22).
Every Whitehall department should be required to:
- Half the number of civil servants working on EDI activity in every department, saving £5m – £10m150Based on average diversity officer salary of £32,000..
- End the membership of external benchmarking schemes, such as the Stonewall Diversity Champion programme.
- End the use of contractual time and taxpayer’s funding being used for staff networks. Such activities should occur outside working hours, in staff members’ own time, or within the formal structures of union facility time.
- End systematic, mandatory or all-staff EDI training, using training only for staff where a specific problem has been identified and where there is an evidential basis to support the training used.
4.6.5. Modernisation and Digital
The implementation of Policy Exchange’s wider suggestions for reform of Government, from open recruitment to the improved use of digital and data, are an essential prerequisite to any programme of Whitehall efficiency.151link
Digital, data and technology can transform the policy-making process and improve the delivery of public services. Whitehall’s departmental structure makes it intrinsically difficult — though not impossible — to pursue a coordinated and innovative approach to digital, data and IT. The purchasing of new technologies and the development of digital systems often occurs in parallel across government departments, even though the requirements or business operations of the technology being used are often identical. This makes it difficult to design citizen-facing services that span across multiple departments and difficult for departments to access and use relevant high-quality data.
In June, the Government published a new roadmap for digital and data in the public sector, which sets out 21 actions based on six missions.152https://www.gov.uk/government/publications/roadmap-for-digital-and-data-2022-to-2025/transforming-for-a-digital-future-2022-to-2025-roadmap-for-digital-and-data Any funds set aside for the delivery of this strategy should be maintained. Furthermore, the Government should also publish a dedicated digital procurement strategy. Such a procurement strategy should focus on removing the structural barriers and obstacles that exclude start-ups and SMEs from bidding for Government contracts. In doing so, the Government should also increase the size of the UK GovTech Catalyst fund.
The Government should also set out the criteria by which it will assess the standard of digital services. By 2025, at least 50 of the Government’s top 75 identified services will move to a ‘great’ standard, against a consistent measure of service performance. This target is too unambitious. The Government should create a target for all of the 75 identified services to move to a great standard by 2025. Furthermore, the Government is yet to set out what would constitute a ‘great standard’. This should also be comprehensively set out, and assessed independently.
As recommended in previous Policy Exchange reports, the Government should establish a dedicated ‘Data Science Profession’.153https://policyexchange.org.uk/publication/reform-of-government-what-do-we-want-from-the-next-prime-minister/#contents__accordion The Civil Service is divided into over 25 specialist professions, including one for Digital, Data and Technology (DDAT). The Government should establish a new data science profession, separate from the Analysis and DDAT Professions. It must ensure that the profession is established based on dual-track career development. This would allow increased pay for some members of the profession without requiring that they be placed into supervisory or managerial positions. It is essential that pay progression does not require DDAT professionals to take on less technical roles, particularly given that pay for such roles in the private sector can be incredibly high. Urgent consideration should be given to this, not least due to the fact that the fast pace of technological innovation means that the skills required of CS data scientists changes in a short space of time. This is not the case within some other professions (such as contract management, for example). If successful, this principle should be applied to the wider DDAT profession.
4.7. Science and Technology
Science and Technology (S&T) is an essential ingredient to prosperity and security. According to Cambridge Econometrics, if UK R&D expenditure increases to 2.4% of GDP by 2027, annual GDP would be higher by £30.5bn.154https://assets.publishing.service.gov.uk/government/uploads/system/uploads/attachment_data/file/897462/macroeconomic-modelling-of-2-4-r-and-d-target.pdf, pp. 7 If R&D spending continues to increase, by 2040 the impacts on GDP and employment will be up to £180bn and 923k high quality jobs will be created.155https://assets.publishing.service.gov.uk/government/uploads/system/uploads/attachment_data/file/897462/macroeconomic-modelling-of-2-4-r-and-d-target.pdf, pp. 7 There is a causal link between government spending on R&D and private sector investment in R&D. Every £1 of public money currently spent on R&D leverages between £1.96-£2.34 of private investment over time and, in total, £1 of public money is estimated to yield around £7 of net benefits.156https://assets.publishing.service.gov.uk/government/uploads/system/uploads/attachment_data/file/897470/relationship-between-public-private-r-and-d-funding.pdf
Government has made numerous public commitments on turning the UK into a science superpower. It committed to:
- Increase public and private R&D spent to 2.4% of GDP by 2027 (though recent statistical updates suggest this may already have been met)157https://www.ons.gov.uk/economy/governmentpublicsectorandtaxes/researchanddevelopmentexpenditure/articles/comparisonofonsbusinessenterpriseresearchanddevelopmentstatisticswithhmrcresearchanddevelopmenttaxcreditstatistics/2022-09-29;
- Continue collaboration with the EU via Horizon Europe and, should we not associate with Horizon Europe, to match every penny of Horizon Europe funding;
- Create a new agency for high-risk, high-reward research agency with a budget of £800m.
These commitments should be preserved. Given the importance of R&D investment on economic growth and productivity, we recommend that the UK’s investment must match the country’s ambitions in this area and the importance of science and technology and that the Spending Review settlement for R&D should be preserved.
4.8. Defence
Unlike other Government departments, the Government has pledged to increase defence spending to 3%. In an era of increasingly profound strategic threats, we do not disagree with this direction of travel; however, unless significant reforms are made first, there is a danger that any increased spending will not deliver a commensurate increase in capability.
In technical terms, the UK military is a “hollow force”. A hollow military is one that apparently maintains robust capabilities, but in fact has almost notability to sustain its capabilities during deployment.
After around 40 years of neglect, the UK nominally fields division-strength ground forces, a rapid-reaction airborne brigade, a two aircraft carrier Navy, an Air Force with precision-strike capabilities and range-extenders, and world-leading Special Operations Forces. Yet very little of this capability can deploy at scale. The UK’s defence industrial base is far more brittle than that of any other major allied state. The Ministry of Defence made the conscious choice – partly for cost reasons, partly because of the strategic climate of the 1990s – to encourage “inbound investment” in defence procurement. In practice, this meant outsourcing and overwhelming production integration into allied supply chains. In turn, accessible reserve stocks remained extremely low: recent estimates indicate that, in a high-intensity conflict akin to the Ukraine War, the UK would run out of ammunition in around two weeks.
Similarly, although the UK does have exquisite high-end platforms, most notably the two Queen Elizabeth-class aircraft carriers, historical procurement and force structure choices severely limits their operational impact. Defence innovation and force development has suffered in the Army as well. AJAX, the Army’s long-awaited family of Armoured Fighting Vehicles (AFVs), was initially purchased in 2010, and set for deployment in 2017. In reality, it is now five years behind its initial deployment schedule, and may not be deployed at all. Poor procurement practices are as problematic as a lack of strategic focus.
The UK is engaged, alongside its NATO allies and like-minded states, in a clear military-political struggle with Russia. It provides massive quantities of arms to Ukraine, significant training and technical-intelligence support, and rhetorically is Ukraine’s greatest backer beyond the US and the Baltic States. It also has a distinct interest in events beyond Europe. Iran is poised for a confrontation with the UK’s Middle Eastern partners, and has openly collaborated with Russia in Ukraine. China, meanwhile, approaches confrontation over Taiwan, a move that would jeopardise British economic and strategic interests in the Indo-Pacific, and must therefore be deterred or defeated.
The danger in an austere environment, even with a significant nominal budget increase – an increase of around 60% in real terms, the greatest budget increase in the post-War period – is twofold. First, the UK’s defence system will be incapable of absorbing these new funds and directing them efficiently, resulting in a military that is properly funded in the abstract, but remains unfit for purpose. Second, other departments will attempt to cannibalise the new defence budget, while Defence, jealous of its financial priorities, refuses to coordinate where eminently prudent with other departments.
These dangers can be remedied in three respects. First, the threat to the UK must be defined, and the role of the military located within this threat – the UK Armed Forces, and each of the services, requires a strategic concept. Second, from this strategic concept, a coherent force structure and set of priorities must be generated for each of the services. It is only at this point that we can actually spend in a fiscally responsible manner and deliver the defence structure the UK public deserves.
The government must be credible in its delivery of defence spending increases if this is to be successful. This begins with a clear tax plan to fund its increases. It also includes a phased approach to reaching the 3% of GDP target it has set. The UK should not significantly increase the defence budget within this spending review period, and should not move to spend 3% of GDP until it has resolved how to spend the money we currently allocate more effectively. In the intervening period, the UK can build out the defence infrastructure needed for this spending growth to be used efficiently.
Personnel cost growth plagues nearly all Western militaries. The so-called Tooth-to-Tail Ratio between combat forces and support units has grown throughout the Global War on Terror, a function of the Western coalition largely remaining in super-bases, and restricting the fighting to only a handful of units. There is a serious risk that the military spending injection the Government has pledged will simply trigger personnel head count and cost growth that will suck up the plurality of new funding.
Several measures can be instituted to limit this potential issue.
- First, the top-line number of Civil Servants in MoD and Defence Procurement could be trimmed by some 10%, a measure previous government have floated, without severely impacting MoD efficiency. This could save some £20 million, depending upon which civil servants are targeted.
- Second, the UK should limit Army personnel growth for at least three to five years. The UK still cannot deploy its nominally deployable combined-arms division, and its pseudo-reserve division is likely unfit for medium-term deployment as well. The Army must improve readiness with its current forces prior to gaining new soldiers.
- Third, Army growth should emphasise reservist personnel, not front-line soldiers, partly through inducements to those leaving active service to remain reserve affiliated.
- Fourth, and most controversially, the entire procurement system should be transformed. Defence Equipment and Support (DE&S) was stood up to make procurement more cost-efficient and time-effective. This has not occurred. Procurement would benefit from direct centralisation under the Secretary of State within MoD, and in general, from far greater oversight in an empowered central Defence Secretary’s office, alongside a pruned-back MoD bureaucracy. Conducting this reassessment and shift of procurement prior to increasing MoD’s top-line budget in significant terms, that is, within the next eighteen months, would allow MoD to intake new funds and redistribute them properly.
Overall, we recommend that the Government remain disciplined in its defence budget increase. Considering the chronically poor funding the UK military has received since the Cold War’s conclusion, and the poor procurement choices it has made that compound its limited funding, the need for investment is clear. Nevertheless, it is structure and strategy that must drive budgets, not bureaucratic priorities. UK defence cannot return to business as usual. It must be optimised for a competitive age. Hence the need for fiscal discipline: throwing bad money down bad holes is a recipe for renewed disaster.
Next chapter5. Supply Side Reforms
Neither tax cuts nor spending restraint will unleash growth without supply-side reform. No matter what the Government ultimately decides on fiscal measures, it must also set out a credible plan for its supply-side agenda for growth over the short, medium, and long-term.
This requires reforms to planning processes, labour, and financial markets, as well as policies to support skills, infrastructure, and innovation. Whoever is Prime Minister, from whatever political party, these are the big barriers to growth which must be addressed to solve the UK’s productivity crisis and restore growth to pre-2008 levels.
The greatest areas of opportunity lie in:
- Home ownership and planning
- Childcare
- Reforming retained EU law
- Investment
- Reducing business bureaucracy
Policy Exchange will be publishing further papers, exploring a number of the supply side issues in more depth, in the coming weeks.
5.1. Home Ownership and Planning
The UK’s housing market is dysfunctional. Not only are houses getting more expensive, they are getting smaller too. Despite the ratio of house prices to median earnings rising from 3.55 to 8.93 in the last 25 years,158ONS, House price to residence-based earnings ratio. 2022 Link. houses are nearly 20% smaller now than they were in 1980.159ElectricalDirect, Are houses getting smaller? How much house do you get for your money?. 6 August 2021. Link.
Ratio of median house price to annual earnings
Source: ONS, House price to residence-based earnings ratio. Link.
British citizens are living in homes that are smaller than they should be and more expensive than they should be because the UK has not built enough and does not build enough housing.
Dwellings per 1000 inhabitants
Not only does the UK have fewer dwellings than most comparable European countries, the UK builds fewer yearly too. Between 2011 and 2019 (the last year UK-wide data is available), the UK built around 1.5 million homes, or 2.5 per 1,000 inhabitants. Despite having an almost identical population, France build 6.7 homes per 1,000 inhabitants, or 4 million homes, in the same time period. Across all developed economies, best represented by the OECD, the UK would have to build an additional 1,792,000 homes.160Author’s calculations, based on OECD data
This lack of housebuilding has been occurring for some time. Between 1971 and 2019, or the last 50 years, the number of new homes being built per 1,000 people has more than halved, from 6.5 to 2.5.161Author’s Calculations using ONS and House of Commons data.
Number of Houses Built On Average Per Year Per Decade
Finland offers an excellent example of how private construction can help everyone. Helsinki, Finland’s capital, has a property market of which 18% is rent-controlled social housing, the rest of the stock’s prices and rents are determined by the market.162Bratu et al., City-wide effects of new housing supply: Evidence from moving chains. VATT Institute for Economic Research, Helsinki, 2021. Link.
Bratu et al. found that, for every 100 market rate units built in up-market, centrally located parts of Helsinki, 29 units were created in the bottom quintile of income, and 60 units were created in the bottom half of the income distribution through vacancies. This occurred quickly, within a year or two of new units being built.163Ibid.
England also has a planning system that prevents building the required number of houses. Every local authority in England is expected to develop a ‘Local Plan’ which determines land use in the local area. Local authorities retain, in the vast majority of cases, the ultimate power over all land development in their area.
It is a fundamentally political system, as local councillors have an enormous amount of discretion over development, which stunts the creation of a rules-based market, and which does not create the certainty to build houses and plan for more houses over a long period of time. In the UK, the right to construct is conferred case-by-case according to sets of complex and often contradictory policies and case law.164Airey, Jack. Rethinking the Planning System for the 21st Century. 27 January 2020. Link. Because of this uncertainty, developers will ‘land-bank’ meaning that they will not develop on land that has received planning permission, to hedge against the risk of other planning permissions.
As we have proposed previously in our paper Rethinking the Planning System for the 21st century, the UK should move to a world-class zoning-led system of development and end detailed land-use allocations.
Zoning is used in most developed countries, like the United States, Canada, Australia, New Zealand, Japan, Germany, France, Italy and the Netherlands. The UK is the only country in the G7 that does not have a zoning planning system of some kind.
Zoning gives communities the right to set requirements for what kinds of structures can be built, and under what terms they can be built. They work well with design codes, since design codes can ensure communities can agree upfront on the ‘look’ of their neighbourhood while also giving certainty to the system as a whole.
Houston is famous for being the largest city in the US without zoning for use rules, meaning that it theoretically has very lax rules about who and what can build where. However, design codes and historic district codes in the city have effectively created bottom-up restrictions while also maintaining strong market forces.165Olin, Andy. Houston doesn’t have zoning, but there are workarounds. 12 January 2020. Link. The result is a far healthier market than in the UK. Houston has 7 million people, and in 2020 (the pandemic year) started 70,000 dwellings. London, with a population of 9 million, started 13,500. As full proof of how zoning can make an impact, Austin, Texas, which much stricter zoning rules, started over 40,000 dwellings in that same period; Austin has 2 million people.166Fulton, William. Despite the pandemic, Austin, Dallas and Houston all built more housing last year. It still wasn’t enough. 20 July 2021. Link. The average house price in Houston is £263,000, exactly half that of London.167ONS, UK House Price Index: May 2022. Link.
100,000 new Council Houses a year
One of the most effective means of creating affordable housing would be to further accelerate the recent growth in the construction of council homes.
Over the past forty years, of all housing tenues in Britain, it is council housing that has declined the most. In 1981, council housing accounted for 95% of the socially rented housing sector and 31% of total UK housing stock (6.6 million homes)168MHCLG, Dwelling Stock by tenure, Live Table 101. Today it accounts for 76% of the socially rented housing sector (with housing association properties principally comprising the remainder) and just 13% of total UK housing stock169https://www.telegraph.co.uk/business/2021/12/05/tories-must-build-council-houses-churchill-would-approve/ (3.1 million homes)170https://commonslibrary.parliament.uk/research-briefings/cbp-8963/.
Housing Completions by Year
The fall in council house occupancy has been matched by a similar sharp decline in council house construction. In 1953, under the Churchill government’s extraordinary housebuilding programme (led by then Housing Secretary Harold Macmillan), over 200,000171https://municipaldreams.wordpress.com/2014/06/24/social-housing-under-threat-keep-it-affordable-flourishing-and-fair/ council homes were built. This accounted for almost two thirds of the stupendous 318,750172https://rgshistory.com/2015/02/27/the-houses-that-mac-built/ homes built that year and still holds the record for the highest number of council homes ever completed in one year in British history. Yet, in 2004, the number of council houses constructed in Britain had collapsed to just 134173https://www.telegraph.co.uk/business/2022/04/16/gove-paves-way-council-housing-explosion/.
The fact that council housing offers cheaper rents than affordable housing (around 40 to 50% of local private levels) makes it uniquely placed to offer a supply-side solution to the affordability gap Help to Buy’s demand-side solution attempted to bridge. This would be of particular benefit to young people priced out of the housing market, a constituency of significant social and electoral importance and for whom a replacement strategy for Help to Buy is desperately required.
It would also significantly reduce state spending on housing benefit. State spending on housing benefit stood at £30.2bn in 2020 and is forecast to balloon to £71.4bn by 2050, the latter figure representing a gigantic 330% increase from 1996 levels174https://www.insidehousing.co.uk/news/news/housing-benefit-bill-to-hit-71bn-by-2050-58815. The UK now spends more on housing benefit as a percentage of GDP than any other OECD country, and one and a half times more than the second highest, Finland.175OECD, OECD Affordable Housing Database. 2022. Link. Diverting benefits, that often end up in the pockets of private landlords, towards the construction of new council housing will represent a more efficient and cost-effective use of public money.
In 2020-21 Homes England, the government’s Housing Delivery Agency and a DLUHC non-departmental body, provided grants of £1.18bn to fund the delivery of affordable housing, essentially housing offered at 80% of local market value. In the same year, 24,245 houses funded in this manner were completed176https://www.nao.org.uk/wp-content/uploads/2021/11/Departmental-Overview-2020-21-Department-for-Levelling-Up-Housing-and-Comunities.pdf. While grant awards might not refer to the same financial cycle as housing completions, this approximately works out as a government expenditure of £48,000 per affordable home. The raising of the Housing Revenue Account borrowing cap in 2013177https://www.publicsectorexecutive.com/Public-Sector-News/osborne-raises-housing-revenue-account-borrowing-cap-by-300m and its subsequent abolition in 2018178https://www.gov.uk/guidance/housing-revenue-account led to an increase in council house completions in England from 1,350 in 2010 to 3,810 by 2019179https://www.ons.gov.uk/peoplepopulationandcommunity/housing/datasets/ukhousebuildingpermanentdwellingsstartedandcompleted. While an improvement, this is substantially down on the 147,000 homes a year councils were building in the mid-1950s180https://www.housing.org.uk/about-housing-associations/about-social-housing/.
However, changes to the Housing Revenue Account borrowing cap should be built upon further by ensuring councils are able to keep more of the proceeds they gain from the sale of assets. In order to fully galvanise council house construction, some, including Lord Baron Porter of Spalding, have urged that councils should be able to keep 100% of their capital receipts181https://www.local.gov.uk/topics/housing-and-planning/council-housing-100/future-council-housing. Capital receipts are the incomes councils receive from the sale of council assets, such as council houses under Right-to-Buy. However, while the government has recently increased the flexibility with which capital receipts can be used182https://www.gov.uk/government/publications/final-guidance-on-flexible-use-of-capital-receipts, severe restrictions remain in place. Namely, only 25% of receipts arising from sale of council houses and 50% of any other housing receipts can be used for the construction of new council housing183https://rds.eppingforestdc.gov.uk/documents/s44855/C-024%20Capital%20Programme%20Review%20App%20II.pdf. Local councils in England received £3.4bn in capital receipts in 2021 of which approximately half were generated directly from housing sales184https://assets.publishing.service.gov.uk/government/uploads/system/uploads/attachment_data/file/1086491/Local_authority_capital_expenditure_and_receipts_in_England_2021_to_2022_provisional_outturn_and_2022_. (Between 1998 and 2018, housing capital receipts accounted for £38bn185https://assets.ctfassets.net/6sxvmndnpn0s/19Sv5Wb6YBX1W1uE9Dgo5t/242fe386e414677380802b0c9afc847d/Capital_Economics_Confidential_-_Final_report_-_25_October_2018.pdf, averaging at around £1.9bn per year).
If 100% of this housing capital income were permitted to be used on the construction of new council housing, then according to Lord Porter, this could build 100,000 council homes over the life of the next Parliament, or the equivalent of 20,000 council homes a year. Were Homes England’s £1.18bn Affordable Housing Grant also added to the new fund, then this figure could potentially increase by a further 10,000.
The Government should seek to reclaim social housing as a great supply-side achievement, by building at least 100,000 new council houses a year. Councils should be able to keep a greater proportion of their capital receipts from sale to finance new housebuilding. A new generation of fiscally responsible and well-designed council houses freed from the anti-social stigma would have tremendous benefits for both citizens and public expenditure.
5.2. Childcare
Childcare in the UK is extremely expensive. This is partly because of the current regulatory framework, which makes it harder to be a childminder and constrains supply throughout the childcare market. This is an excellent example where public and private regulation distorts markets.
Weekly Cost of Childcare
Family and Childcare Trust186Family and Childcare Trust, Childcare Surveys 2012-2022. Link
Childcare costs have increased substantially over the last 10 years. The weekly cost of a nursery for under-twos has risen by £36.65 a week, or an additional £1,906 a year. Adjust for inflation and parents are paying £14.40, or £749 more a year in childcare in real terms. This is despite the fact that the UK has a larger subsidy as a proportion of household income than either the EU or OECD.187Farquharson, Christine. Complicated, costly and constantly changing: the childcare system in England. 13 September 2021. The IFS. Link.
Part of this problem is the reduction in the number of childminders over more than a decade. There were nearly 56,000 childminders registered in 2010, and there are now just under 34,000. Unlike many other countries, childminders have a higher regulatory burden and are more restricted in where they can operate. Their French counterparts can practice childminding in dedicated centres, called maisons d’assistants maternels.
In the Netherlands, childminder agencies dominate, and give direct support to childminders across their professional responsibilities. No similar non-domestic provisions exist in the UK, and childminder agencies are much weaker. Despite this, childminders are also subject to the same highly prescriptive Early Years Foundation Scheme. Thus, the Early Years Foundation Scheme burden should be reduced, childminders should be able to work in non-domestic settings, and childminder agencies should be expanded, potentially by re-purposing some unused Tax-Free Childcare money (as set out in a previous report) or by re-directing money currently used by Ofsted to register childminders. Government should aim to recruit an additional 20,000 childminders in the next five years through these reforms.
The other element responsible for relatively high costs in the UK are the relatively low staff-student ratios.
Staff-Child Ratios - Select European Countries
Eurydice188Eurydice, Key Data on Early Childhood Education and Care in Europe, 2019 Edition. Link.
This is even though there is little evidence that low ratios and strict curriculum requirements have a positive impact. Moreover, the child to staff ratios used in England are some of the tightest in the world, with little benefit. The Australian Productivity Commission has noted that, when it comes to staff ratios, “the optimal standard for these variables and the quantitative difference in educational outcomes associated with different levels is unclear”.189Productivity Commission, Childcare and Early Childhood Learning. Productivity Commission Inquiry Report Volume 2. 31 October 2014. Link. The Canadian government agrees: “research cannot provide a sound empirical basis for recommending universally appropriate group sizes or optimal child-staff ratios.”190Government of Canada, Defining and measuring the quality of Early Learning and Child Care: A literature review. 2019. Link. What is clear is that ratios can increase the cost of care, and higher ratios can reduce the costs, without greatly impacting quality.191Thomas, Diana and Gorry, Devon. Regulation and the Cost of Child Care. Mercatus Center, George Mason University. August 2015. Link.
In the UK context, this needs to be balanced against the fact that the introduction of the EYFS has also ensured a minimum standard and resulted in weaker providers being held accountable.192Ofsted, The Impact of the Early Years Foundation Stage, 2011. Link. The solution here is to ensure that weaker settings do not get to save money by reducing standards further, but letting better settings take advantage of regulatory flexibility, experiment with the delivery of the EYFS, and increase ratios. Experimenting with increasing ratios is in particular a good idea, since there are reports that some settings over-segregate by age because of the strictness of the UK’s current framework.
In our report Better Childcare (2002), Policy Exchange has set out a number of important supply-side reforms, including:193Policy Exchange (August 2022), Better Childcare: Putting Families First; https://policyexchange.org.uk/wp-content/uploads/Better-Childcare.pdf
- Expanding child-staff ratios in England from a ratio of 1:4 to a ratio of 1:5 for two-year olds – in line with rules in Scotland.
- Taking strong measures to reverse the decline of childminders as a profession. This means taking an outcomes-based approach to regulation, removing regulatory burdens and encouraging the creation of childminder agencies to oversee the sector. Creating new ‘childminder hubs’ modelled after the French maisons d’assistants maternels.
- Giving settings the freedom to flex ratios and vary other aspects of the EYFS regime, based on outcomes.
- Allowing the Universal Credit Childcare entitlement to be used for settings not on the voluntary childcare register for children over eight.
5.3. Reforming retained EU law
The mechanisms in the proposed Retained EU Law (Revocation and Reform) Bill offer an important opportunity to support the Government’s supply-side objectives outlined in the Growth Plan. The proposed Bill will abolish the special status given to retained EU law under the European Union (Withdrawal) Act 2018 and will enable the Government, via Parliament to amend more easily, repeal and replace retained EU Law. The Bill will sunset retained EU law so that it expires on 31st December 2023, unless it is otherwise preserved. The sunset may be extended for specified pieces of retained EU Law until 2026.
However, the tight timescales envisioned in the Bill mean that the Government will need to prioritise its efforts to have the most impact. It will be difficult to remove entire regulations wholesale and, given the limited time available, there is a consequent risk that the strong forces of inertia within Departments leads to the opportunity to reform retained EU law being missed or significantly delayed and much of this regulation being kept in its present form.194It should be noted that the legal status of retained EU law will be changed by the Bill. Currently, retained direct EU legislation takes priority over domestic UK legislation passed prior to the end of the Transition Period when they are incompatible. The Bill will reverse this order of priority, to reinstate domestic law as the highest form of law on the UK statute book. The Bill will also provide domestic courts with greater discretion to depart from retained EU case law.
According to the Government’s mapping exercise, there are currently 2,006 pieces of retained EU law that remain unchanged (196 have been repealed, 182 amended, and 33 replaced).195HMG, EU law dashboard; https://public.tableau.com/app/profile/governmentreporting/viz/UKGovernment-RetainedEULawDashboard/Guidance The majority of retained EU law is concentrated among relatively few Departmental areas:
- 570 – DEfRA
- 424 – DfT
- 374 – HMT
- 318 – BEIS
- 228 – HMRC
The Government should therefore focus its effort on reforming EU law where it will do most to support the wider objectives outlined in the Growth Plan.
For example, the Government has pledged to reduce barriers to speed up the planning process and progress of major infrastructure projects. The cumulative impact of environmental and habitat regulation increases delays to planning decisions – many of these rules stem from retained EU regulations and case law.196See https://insights.maplesteesdale.co.uk/post/102hlxf/nutrient-neutrality-time-for-brexit-to-show-its-benefits In 2022 a growing number of local planning authorities have learned from Natural England that development in some catchments cannot proceed if it increases levels of nutrients and that development can only proceed if it is “nutrient neutral”.197LGA, Nutrient neutrality and the planning system; https://www.local.gov.uk/pas/topics/environment/nutrient-neutrality-nn-and-planning-system; The source of the new advice is the EU Habitats Directive, implemented in England through the Habitats Regulations, and the subsequent jurisprudence of the European Court of Justice. The House Builders Federation estimates that “at least 100,000 new homes across 74 Local Authorities are unable to proceed” due to the requirements.198House Builders Federation (June 2022), Written evidence to the House of Commons Public Accounts Committee; https://www.local.gov.uk/pas/topics/environment/nutrient-neutrality-nn-and-planning-system
5.4. Investment
The UK has some of the most developed financial markets in the world. Asset managers in the United Kingdom manage £9.4 trillion in assets, of which £1.7 trillion is invested in the UK.199Investment Association, Investment Management in the UK 2020-2021. September 2021. Link. A key part of this market is insurance, which is currently governed by the Solvency II framework. This is restrictive and means that large pools of capital cannot be used for alternative asset classes.
Patient and private capital investments are also becoming ever more important as fewer companies choose to list on the public markets. There are fewer companies listed on UK markets now than there have been in five decades.200Investment Association, September 2021.
Solvency II reform is a pressing need, as it would allow insurers and financial institutions to back and invest in alternative assets more easily, in particular net zero and other forms of patient capital. This also relates to the pensions problem – current regulations make it harder to insure defined benefit pension funds when they invest in alternative asset classes.
Government should use the Financial Services and Markets Bill and engage with the regulators to unlock capital in insurance companies and pension funds. For insurance companies in particular, there is a strong disincentive when insurance companies cannot invest in an asset class until it has declared an intention to invest thanks to the way the PRA operates.
Current PRA rules and the way they are applied effectively force those bound by the rules to treat assets as if they had a long-term fixed income. This is extremely difficult with many asset classes without strongly disincentivising investment. As a result of the UK’s current regulatory framework, not only is the UK an investment laggard, UK insurers invest less in productive assets than other countries who follow the same Solvency II regime.
Equity Investments as a Proportion of Total Investments, Direct Domestic Insurers
The Association of British Insurers has estimated that reforms to Solvency II could release up to £95bn to boost the UK economy and tackle climate change201https://www.abi.org.uk/news/news-articles/2021/02/post-brexit-reforms-to-financial-regulations/.
Given where the UK is currently, Government should press ahead with proposed reforms to the statutory objectives of regulatory agencies, and in particular make growth a primary, rather than a secondary objective, for the FCA and PRA. The Government has already stated its intention to include new secondary growth and competitiveness objectives for the PRA and FCA. Given the new administration, there is now an opportunity to upgrade these commitments.202HM Treasury, Financial Services Future Regulatory Framework Review: Response to the Consultation. July 2022. Link. Regulators need the impetus to think more seriously of the growth implications of their decisions and discretion, which go beyond the formal regulatory framework.
Government should therefore reform Solvency II. It would unlock much needed investment in UK infrastructure, increase the investment choices available to policyholders, and boost the international competitiveness of the UK’s insurance sector.
5.5. Reducing Business Bureaucracy
Previous evidence suggests that cutting red tape is easier said than done. While Government has set Business Impact Targets to reduce the costs of regulation since 2015, these have not been met. During the 2017-2019 Parliament, government had a target of reducing the cost of regulation to business by £9 billion, but in fact the cost increased by £7.8 billion. In the current 2019 Parliament, government set a cost neutral holding target of zero increase in cost to business, but costs to business increased by £4.5 billion in just the first two years of the parliament. This is before considering the impact of various Covid-related regulations, which are exempted from the target, and have imposed more significant costs on business.203See Chair of the Regulatory Policy Commit- tee Stephen Gibson’s evidence to the House of Lords Secondary Legislation Scrutiny Committee, 5 April 2022; https://commit- tees.parliament.uk/oralevidence/10098/ html/
The Government is planning to replace the Business Impact Target, but has not yet set out details. Ultimately, there is always a risk of a regulatory target of this kind being gamed and meeting such a target depends on the political will to prioritise cost reductions over imposing costly new regulatory requirements and on a robust, consistent, and transparent methodology for assessing the costs of regulation. Therefore, Policy Exchange’s recent Re-engineering Regulation: A Blueprint for Reform204Policy Exchange (August 2022), Re-engineering Regulation: A Blueprint for Reform; https://policyexchange.org.uk/wp-content/uploads/Re-engineering-Regulation.pdf recommended that there should be greater central government oversight and coordination to hold departments to account for meeting regulatory targets.
Government should establish a centralised a regulatory budget process in BEIS, overseen by the BEIS Secretary. Government already undertakes constant reviews of spending – it should do the same with regulation. Departments would receive an expected ‘regulatory budget allocation’ from BEIS, which they would be required to meet. If they did not meet these targets, they would suffer consequences, such as more oversight on expenditure. Government should adopt a target of £15 billion in net regulatory savings to business over the next five-year cycle, or at least £5 billion in this parliament.
Over the medium-term the UK should reform the wider regulatory system, including the role of regulators, to create a more agile and accountable regime. Policy Exchange’s Re-engineering Regulation project’s recommendations include:
- Fewer, more adhortative regulators, in key areas would enable greater democratic accountability for regulatory outcomes, both regarding the protection of the public and the cost of regulation.
- The NAO should be empowered and resourced to conduct and publish regular audits of regulators’ performance, including industry and consumer outcomes for their sector. This evidence should inform accountability to parliament.
- Government should conduct a review with the aim of simplifying and prioritising regulators’ objectives. This would increase accountability for regulatory outcomes.
- Each regulator should ringfence some of its budget to fund an internal challenge function, drawing on feedback from the experience of those that are regulated and consumer representatives.
- Government should require regulators to collaborate, and there should be a statutory duty for regulators to report on how they comply with that requirement. Performance against the requirement should be audited by the NAO.
- Regulators should use collaboration and data-sharing to target their interventions on the routinely uncompliant and take a lighter touch approach to those that can demonstrate a history of compliance.