
I spent Monday afternoon doing a webchat with Schools Week and Nicky Morgan discussing what a majority Conservative government might look like for education (see this excellent piece by Natasha which sets out some of the areas which the DfE might consider).
Unsurprisingly, we spent most of our time talking about coasting schools. My main message here one was one of caution and cool heads. The fact that a government would want to focus on schools where not enough children are making the progress which everyone – schools, society and their parents – would want them to is surely a reasonable ask. We also shouldn’t pretend that this is somehow a new area of interest – indeed, the last Labour government developed a similar approach (to pretty similar sound and fury, I recall) off the back of the Children’s Plan. The (positive) difference this time is that schools will in the first instance be asked to come up with their own plans for improvement which will be at their discretion, rather than a solution imposed from DfE as was the case under Gaining Ground– and if those plans are deemed strong, then they will be tasked to get on with it. ‘Hit squads’ and mass headteacher sackings have been overblown.
One question however which people are rightly asking is what is a coasting school? My answer – and it is only mine, albeit based on how the Labour government did it and some of the things Nicky Morgan has said – is that it is a school where headline results are not necessarily poor, but that insufficient numbers of children are making expected levels of progress from Key Stage 2 to Key Stage 4. But this still doesn’t get us much further, and as this becomes real policy I’d expect DfE to produce a concrete definition and then identify the affected schools, either publicly (like National Challenge did) or privately to the schools and the Regional Schools Commissioners.
In advance of that hard definition though, I produced these two graphs below pretty quickly on Monday. As I didn’t have a chance to use them (although I did consider holding a piece of paper up to the camera to make my point like a bad 1980s Open University video), they’re posted below. Apologies that due to size, a lot of the data points essentially merge onto each other but hopefully the general pattern is clear.
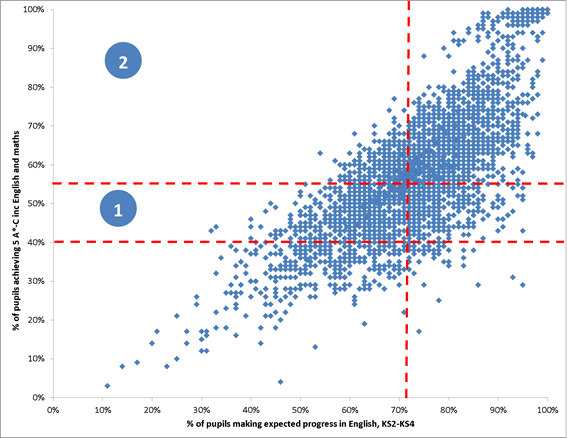
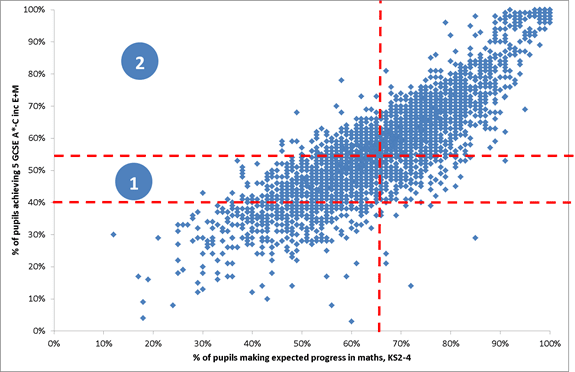
These show the relationship for a group of secondary schools in England from summer 2014 between their headline GCSE results and the progress their pupils made in English and maths respectively between 11 and 16. (Quick note: this data excludes all independent schools, all special schools and alternative provision centres, schools such as new Free Schools that don’t yet have Key Stage 4 data, and also – more debatably – UTCs and studio schools given their slightly different offerings).
It’s clear that there is a quite strong relationship between progress made from 11 to 16 and headline GCSE results. The vast majority of the schools underneath the government’s floor target of 40% pass rate, for example (lower horizontal red line) are also below average for progress made, which is the vertical red line (it should be noted that the government floor target is actually more nuanced than just a headline pass rate, and explicitly includes an assessment of how much progress students are making when considering interventions). Similarly, most of the schools below average GCSE pass rates for 2014 (higher horizontal red line) are also below average progress.
There are however some interesting sectors which are worth considering. The schools towards the right hand side of the vertical red line are ones that are making very high levels of progress with their pupils at secondary – and not all of them high performers. But the ones that are the most relevant for this discussion are those in the sections I’ve labelled 1 and 2.
- Schools in area 1 of the charts are those who are achieving below average GCSE results, but above the floor threshold, and lower than average progress rates. There are 260 of them in English, and 853 in maths (and obviously some schools would be counted in both). As can be seen, some of them are considerably closer to being out of this category than others, so we certainly can’t consider them a homogenous group.
- Schools in area 2 are those achieving above average GCSEs, but below average progress. There are a further 220 of them in English, and 207 in maths (and again, some schools would be counted in both). As with area 1 schools, these won’t be homogenous. But some of these, in particular, I’d expect to be of real interest to government
My suggestion as a starter for 10 is it is from within these two groups of schools that we will find our ‘coasting’ group.