This Wednesday, the Chancellor will stand up to give the results of the Spending Review, setting in place the resources available to Departments for the next four years.
Nobody believes the upcoming Parliament will be as easy as the years of plenty in decades past for public services – but just how challenging a goal has the Chancellor set for himself?
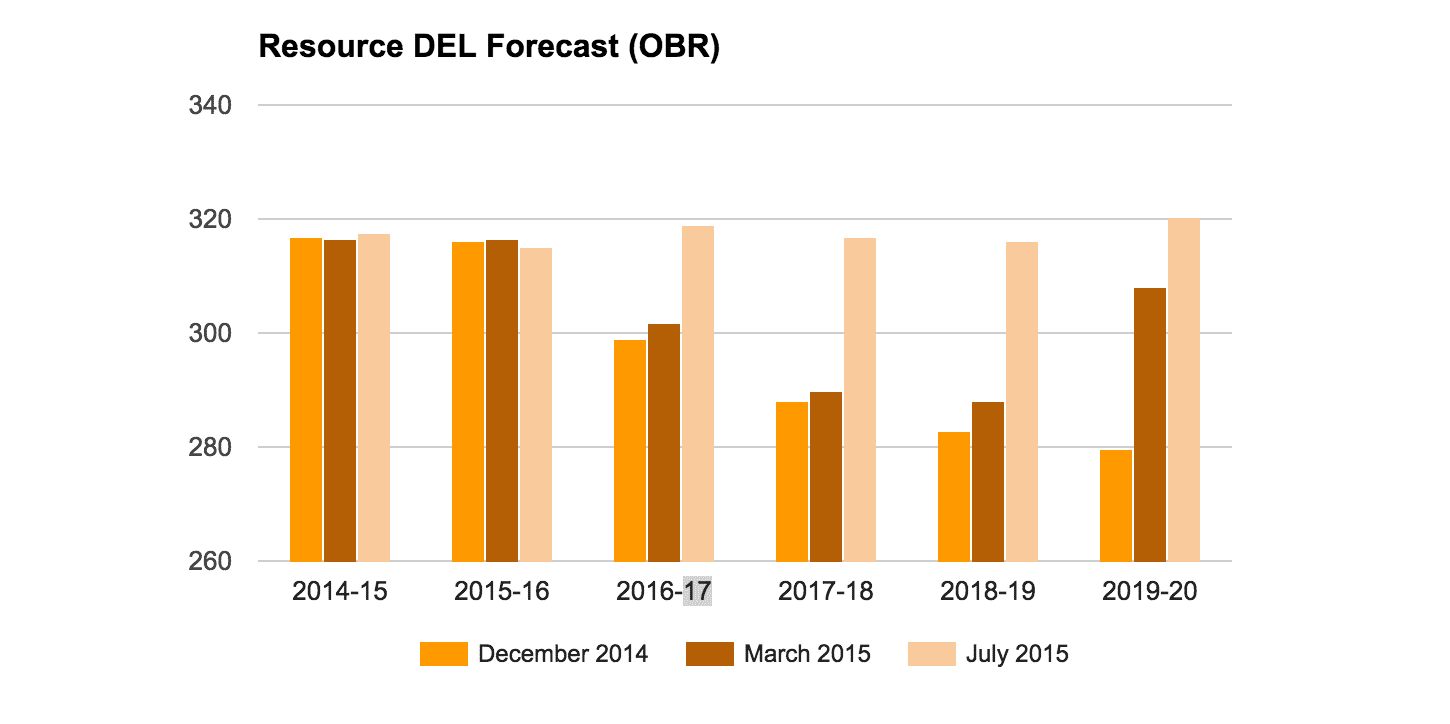
1) We’re no longer going back to the 1930s. This Spending Review has long been anticipated – occasionally dreaded – by those unsure the scale of the savings planned by the Chancellor was really feasible. Peak anxiety came one year ago when many worried that reducing government spending to 35% of GDP would take us ‘back to the 1930s.’ This was always a vast exaggeration, but since then Osborne has also quietly eased up, pushing back the date for surplus an extra year and stopping the shrinking of the state at 36%, while clarifying his promised £12 billion savings from welfare and £5 billion from tax changes. Together, this has meant that current departmental spending is now predicted to be £320 billion in 2019-20, compared to last December’s prediction of £280 billion.
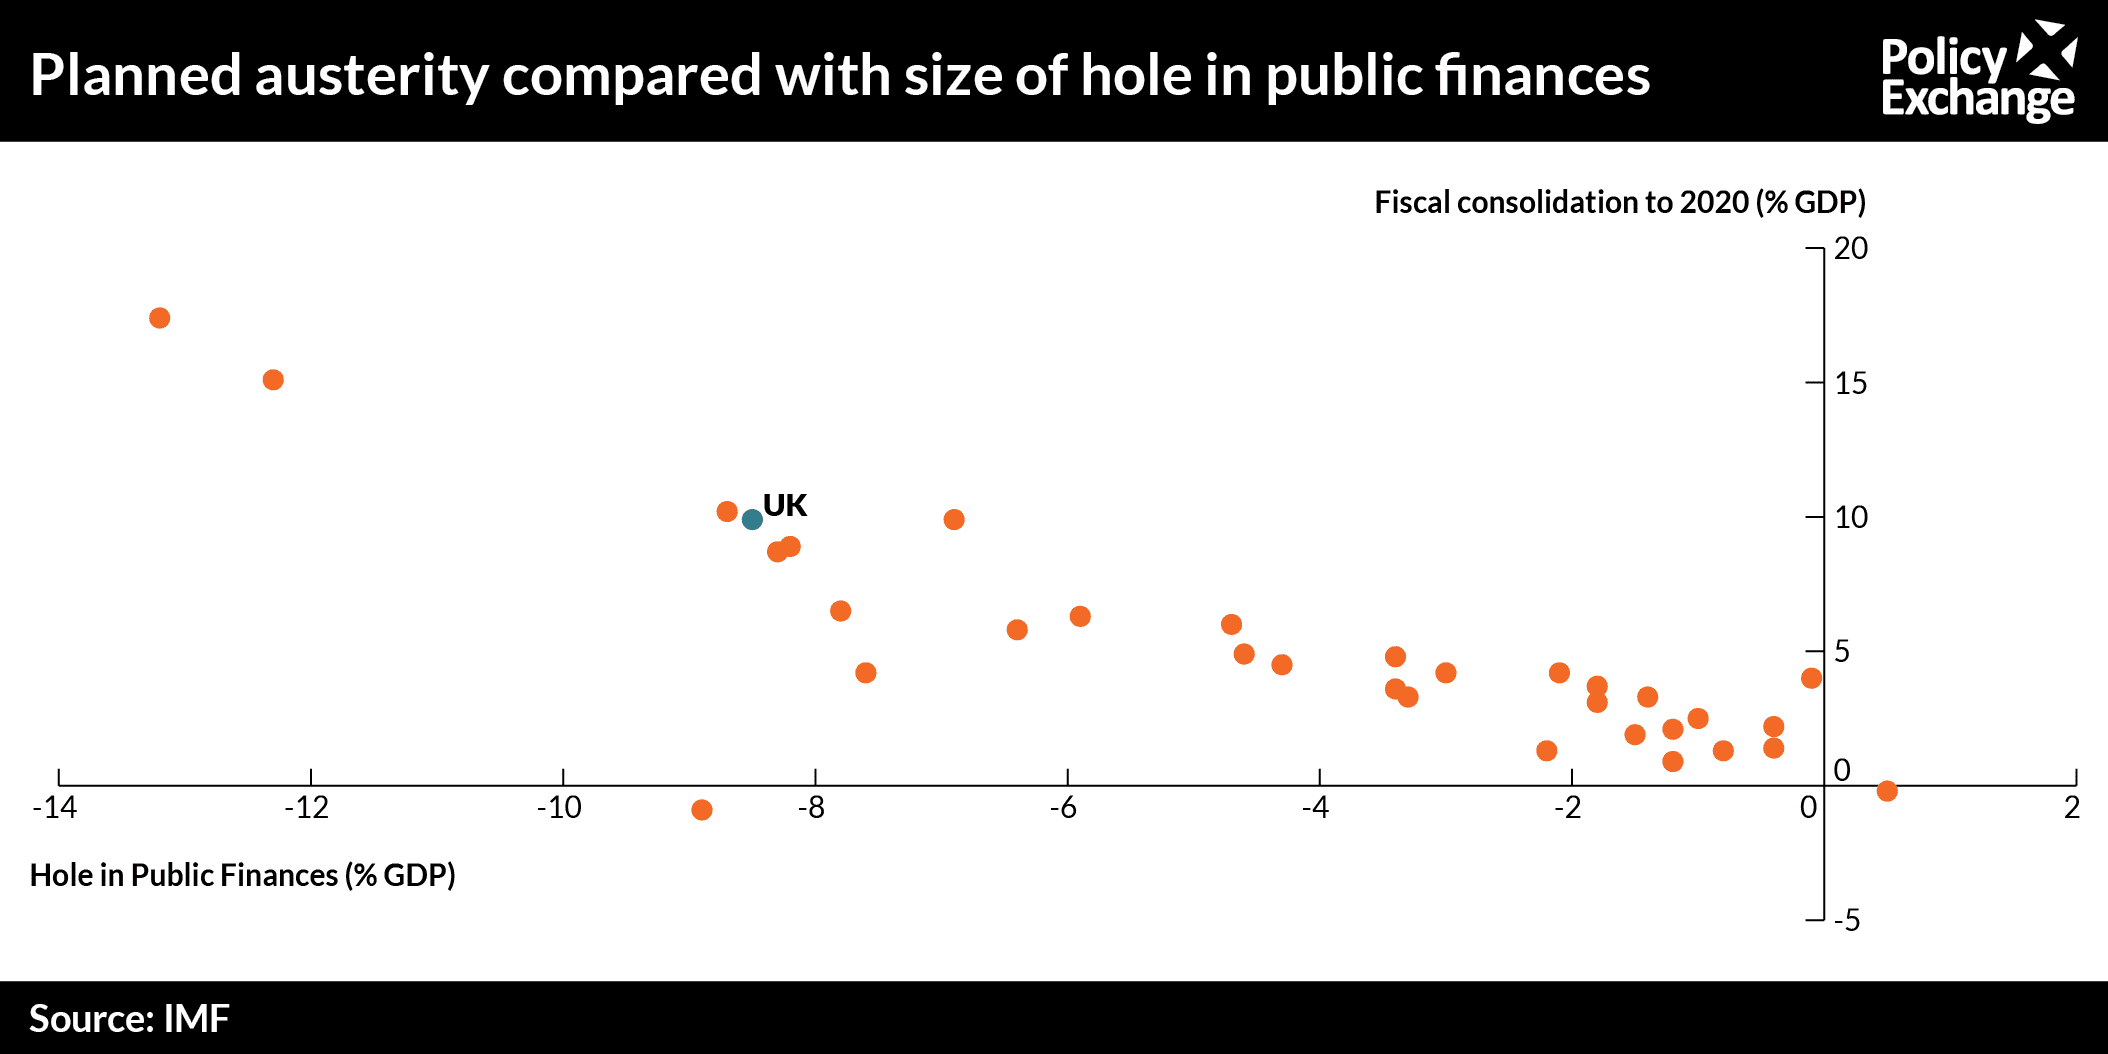
2) There was no easy alternative to fiscal consolidation. Whatever your opinion of the Government’s fiscal rule – and many of the criticisms are unfair or overrated – the reality is that the vast majority of fiscal consolidation was inevitable, whoever was in power. The financial crisis struck around a 15% blow to the expected size of the UK economy, much of which looks unlikely to be reversed, making old plans literally unaffordable. If you compare the consolidation planned by the UK to 2020 to other countries, the UK is basically exactly on trend given the size of the hole we started with. The average reduction in the structural deficit between 2009-10 and 2019-20 is 0.9% of GDP a year, almost bang on the IMF’s rule of thumb of 1% a year.
It could, of course, have been possible to do more of the needed consolidation through tax rises rather than spending increases, but we should be under no illusion that this would have been an easier path – especially at a time real wages and living standards were already stagnating. Between 2009-10 and 2015 the Chancellor implemented £98 billion in spending cuts, very roughly the equivalent of raising the main rate of one of the big three taxes (income tax, national insurance, VAT) by 20 to 25 percentage points, doubling them.
3) In aggregate, fiscal consolidation looks to reverse much of the 2000s spending boom. The last time the UK saw a balanced budget was in 2001, and it is striking if you zoom out to the big picture, how little will end up looking different by the next time the budget is set to be in surplus in 2019-20. A decade of expansion ends up more or less cancelled out by a decade of consolidation. In 2019-10, tax revenues are expected to recover to 36.7% of GDP, only a tiny bit below the 37.7% they were in 2001, while total spending will be 36.3% of GDP compared to 2001’s 36.1%. After temporarily surging in the run up to and during the crisis, public sector net investment will end up at 1.4% of GDP, just above its 1.2% 2001 level. Pensioner welfare will be barely any higher at 5.7% of GDP, although the OBR’s long term projections suggest they will start growing again from the early 2020s. By contrast, after an extended period of freezes, cuts and slower uprating working-age welfare spending is set to not just return back to its 2001 levels, but fall significantly below them.
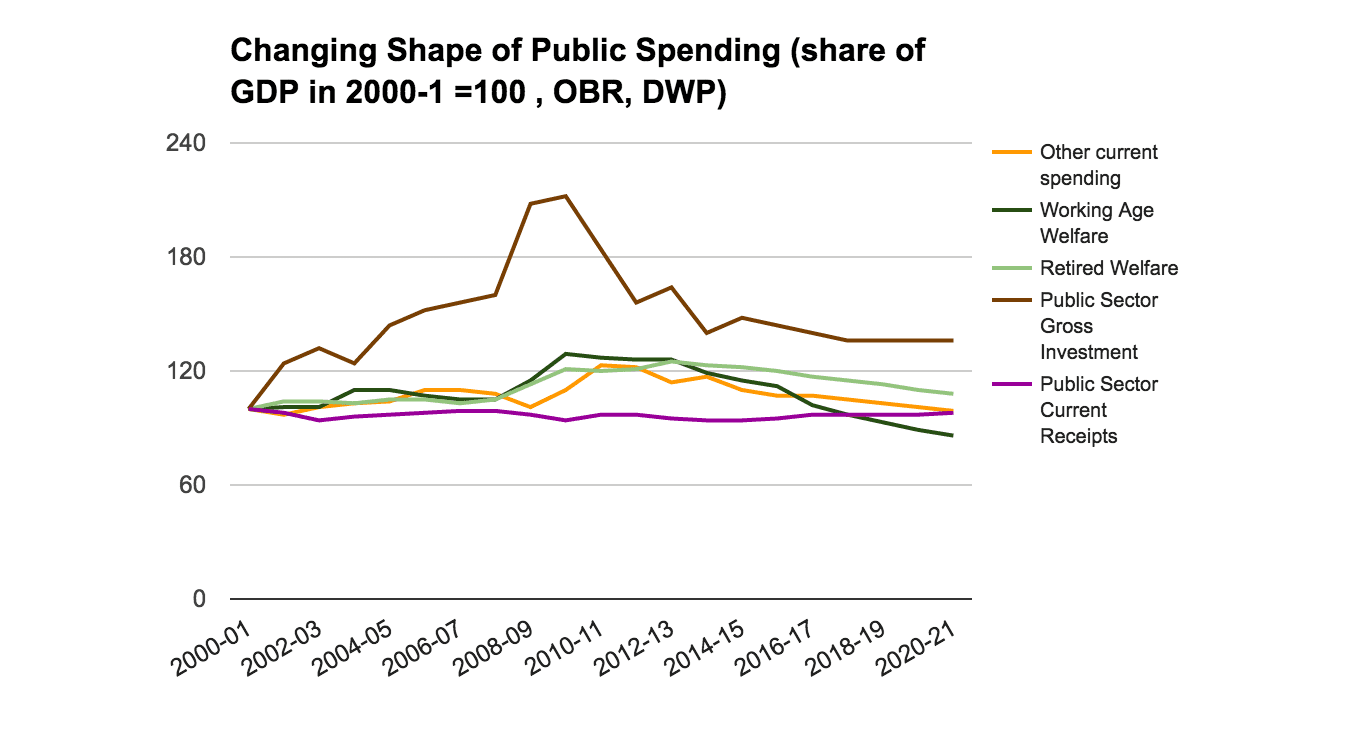
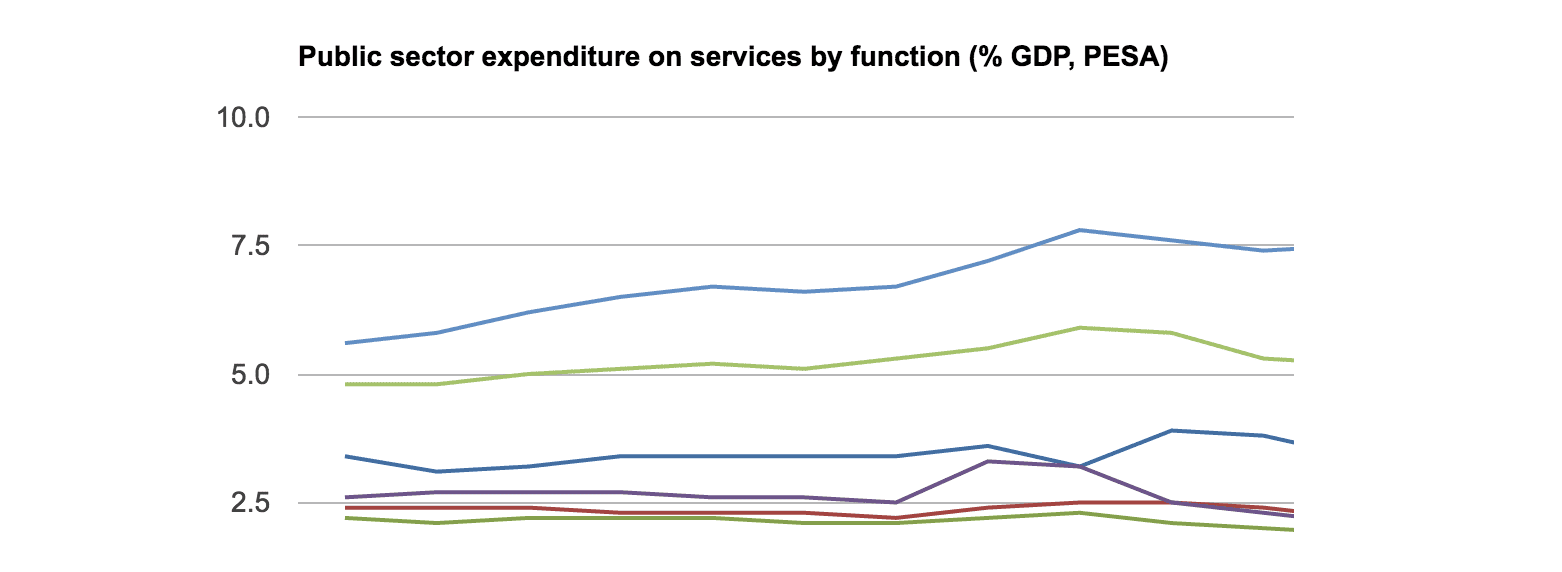
4) At the departmental level however, the shape of the state is changing as health eats up an ever larger part of the budget. By 2019-20, if you exclude welfare, current spending will basically be equal to its 2000-1 level, at 24% of GDP. What has really changed is what that money is spent on. Much of the increase in spending in the 2000s went on the NHS – the NHS workforce increased by 32% between 2000 and 2009 – and this has largely not been reversed since.
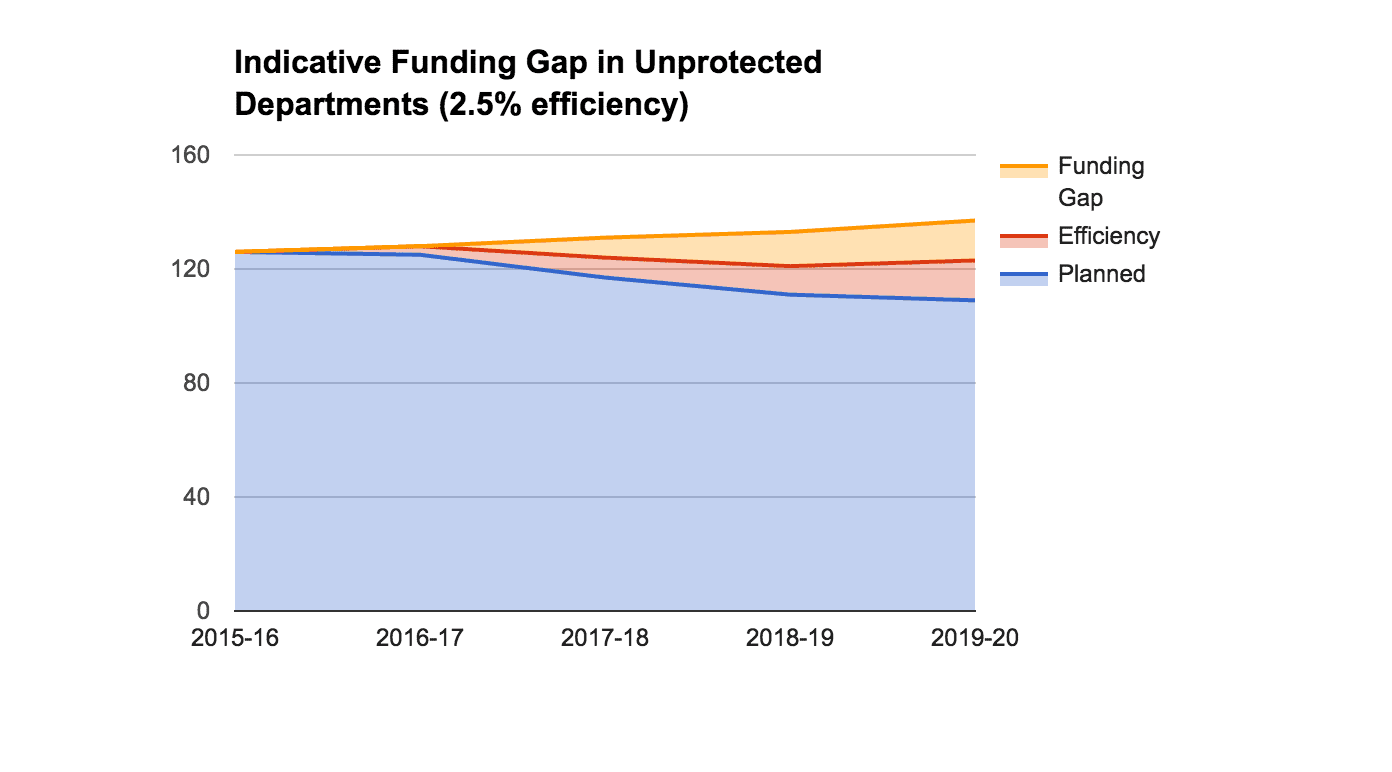
With ring-fencing set to continue for a second Parliament, those departments that have not been fortunate enough to be protected are getting squeezed into an ever smaller share of the state. This more than triples the average cut faced from 5.1% across departments as a whole to 18.8% for unprotected departments – and this comes on top of a 25% real terms cut they already suffered since 2010-11.
5) The upcoming round of savings will be harder than those in the last Parliament. The last Government had a genuinely impressive record at improving efficiency through better management of property, procurement, contracts and workforce, saving £19 billion a year by 2014-15 – but much of this came in the wake of the spending surge of the 2000s, and many of the easiest cuts have now been made. If you exclude pensions, public sector pay is now back around private levels for similarly skilled workers.
That is not to say there is nothing the Government can do, with significant further potential for savings from greater use of digital, joined up services at a local level, and ongoing reform of public sector procurement. Before the election, the Cabinet Office spoke of finding a further £15 to £20 billion in efficiency savings by 2019-20, although this number has been less used recently. To close the funding gap for unprotected departments entirely through efficiency savings, would require to improve their efficiency by 5% year on year – compared against the 2-3% target in the NHS Five Year Forward View, the 1-2% assumption in the LGA Future funding outlook or the 1.2% achieved across the public sector in the latest ONS data from 2012. In practice, the Government is likely to combine efficiency savings with changes to how public spending is financed – converting grants to loans, and in general moving the burden of costs from the general taxpayer to those who benefit directly.